您可以在跟踪代码管理器中预览和调试服务器端容器。
了解预览布局
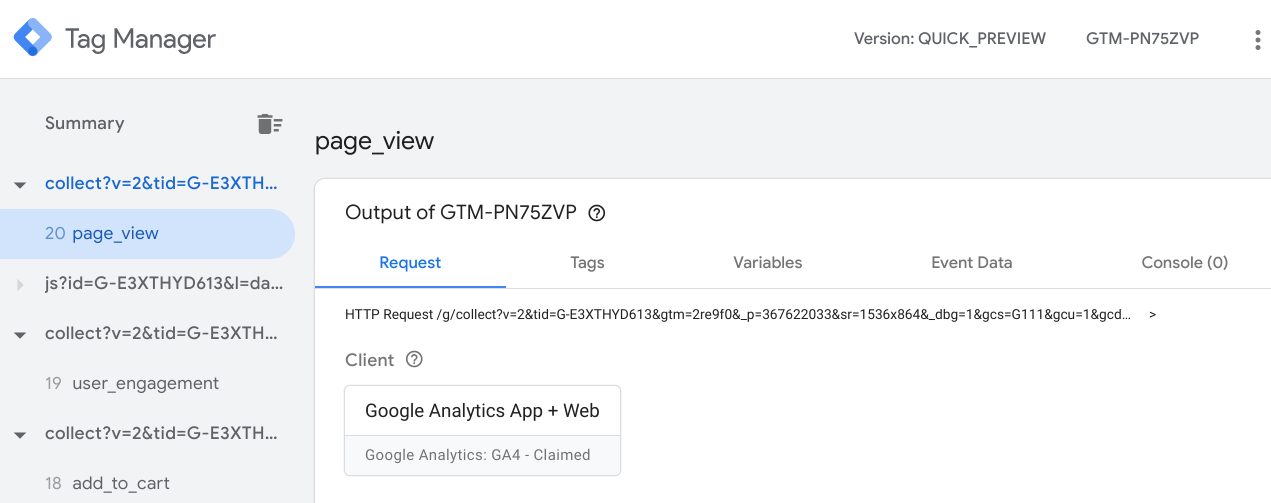
若要打开调试程序,请在跟踪代码管理器中选择您的服务器容器,然后点击预览。
左侧面板会列出传入的 HTTP 请求,例如 collect?v=2&....。如果认领请求的客户端创建了一个事件数据对象(例如 scroll、page_view 或 add_to_cart),该事件将显示为相应请求下的一个子项。
右侧的标签页将显示左侧面板中所选项的详细信息。我们将分别对每个标签页进行介绍。
调试请求
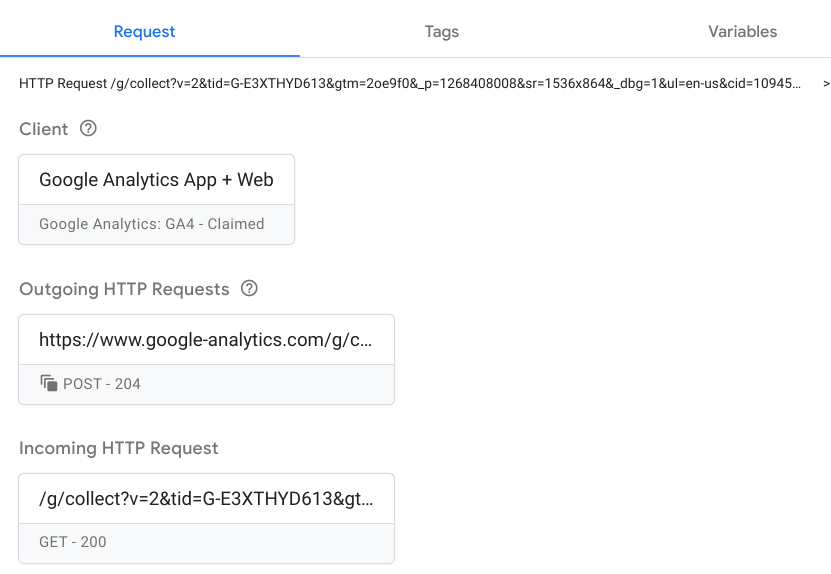
请求标签页包含关于以下各项的方框:
- 认领请求的客户端
- 传出的 HTTP 请求
- 传入的 HTTP 请求
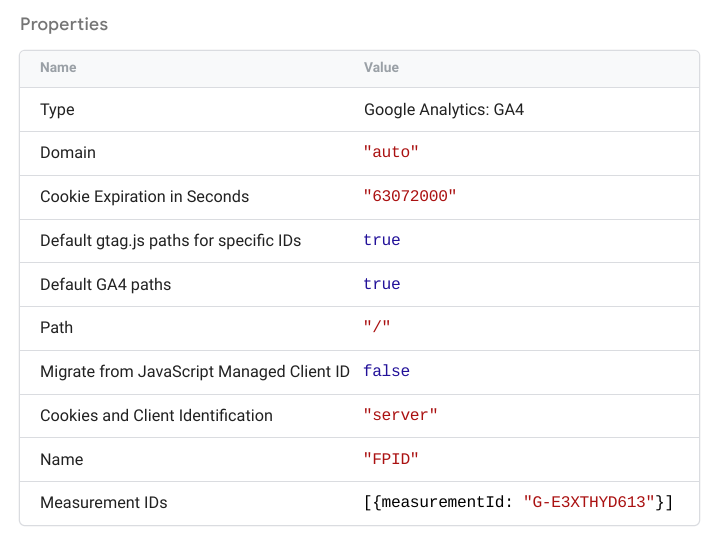
查看认领请求的客户端
服务器容器可以有多个客户端,但一个请求只能由一个客户端认领。相应客户端会识别浏览器所发出请求的格式,并在匹配成功时认领请求。
点击客户端方框可查看相应客户端的详细信息。这些信息应与客户端 > 客户端名称中的客户端配置一致。
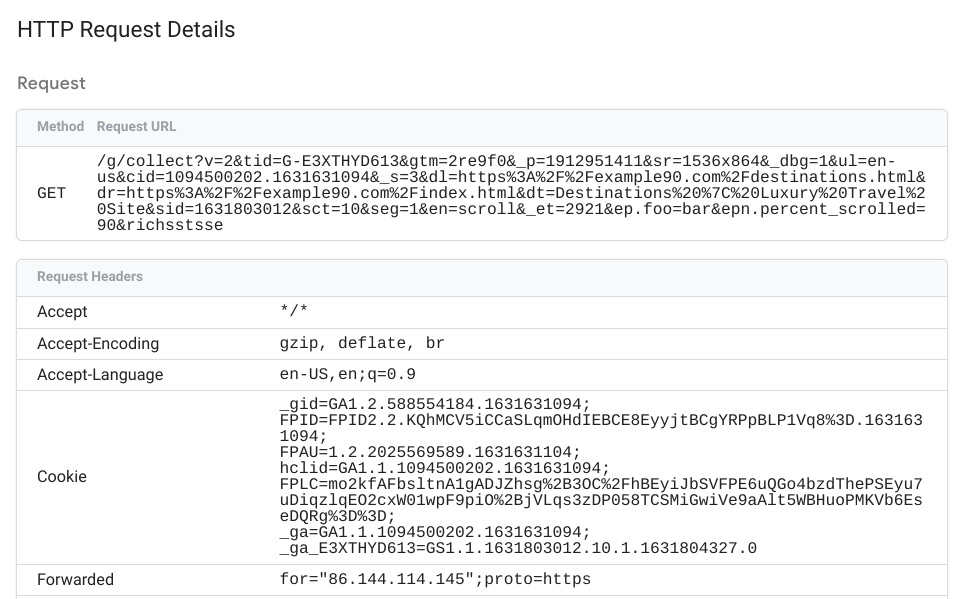
查看传入的请求
点击传入 HTTP 请求方框可查看传入请求的完整详细信息。
请求 (collect?v=...) 应该与您在 Chrome 的“网络”标签页中看到的内容一一对应。请确认它与您在浏览器中看到的内容相符,并且服务器容器接收的参数正确无误。
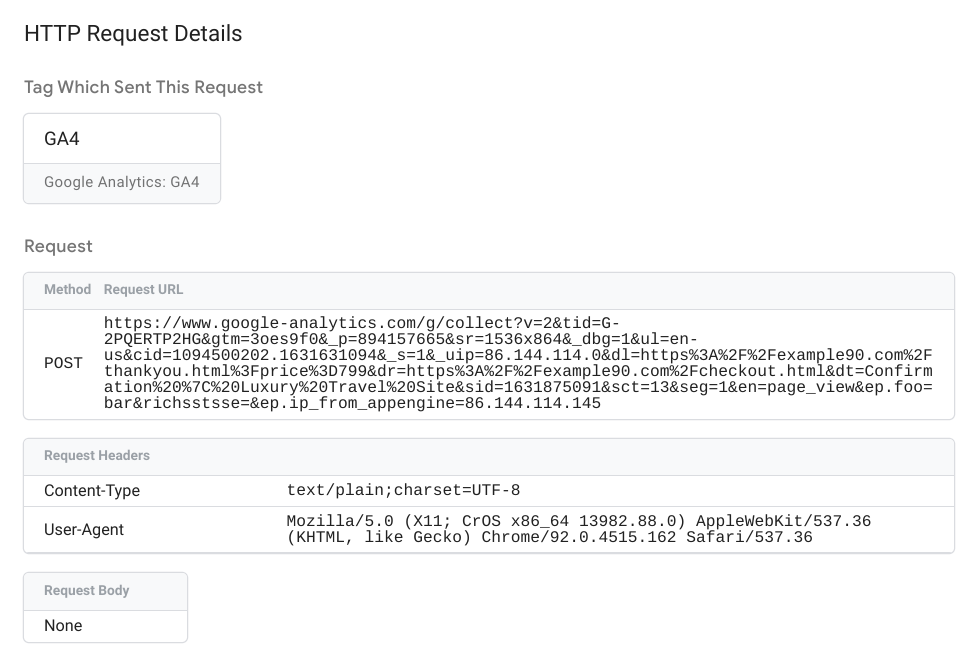
查看传出的请求
点击任一传出 HTTP 请求方框均可查看以下详细信息:
- 生成请求的代码
- 传出的请求
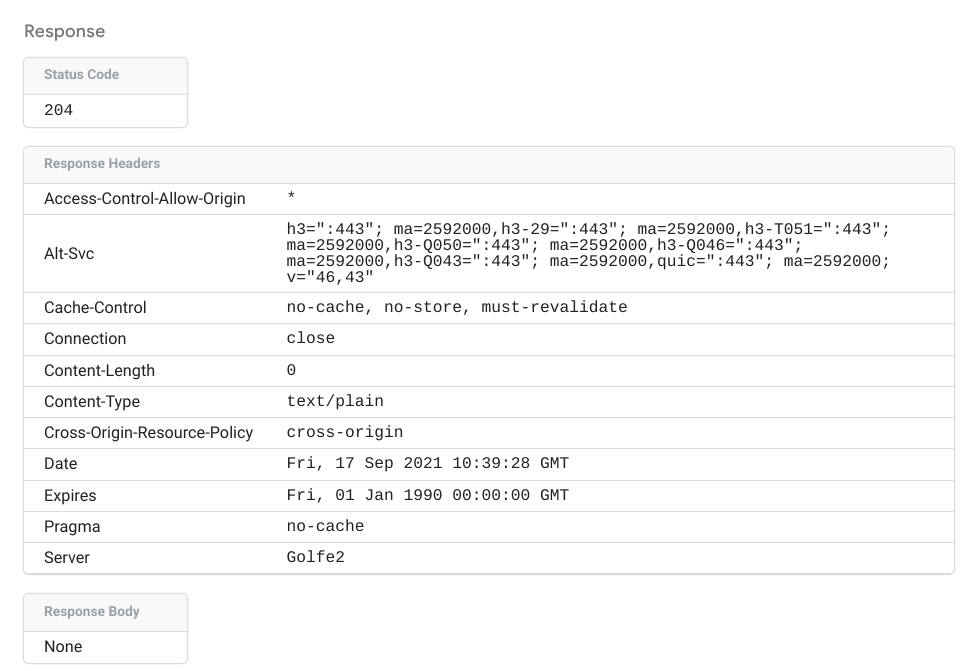
- 供应商端点返回的 HTTP 响应
传出请求的详细信息中会包含服务器容器发送到供应商端点的数据。
响应信息中会包含供应商端点返回的状态代码、标头和正文(如果有)。
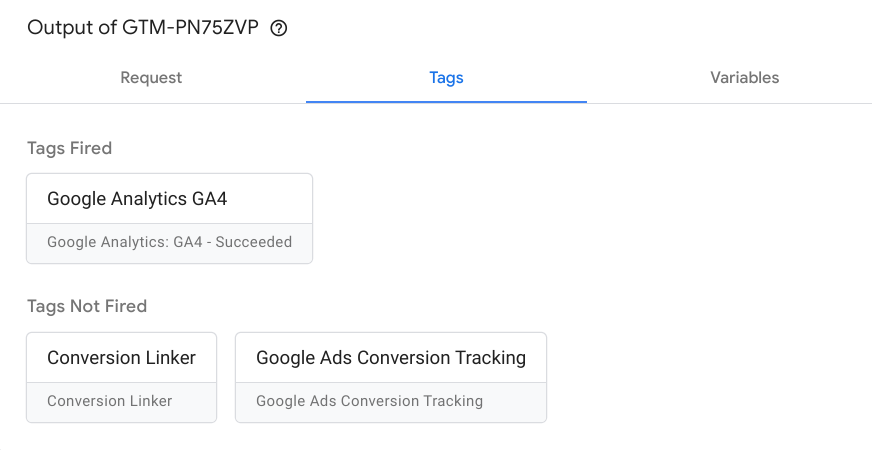
调试代码
代码标签页会列出已配置的所有代码:
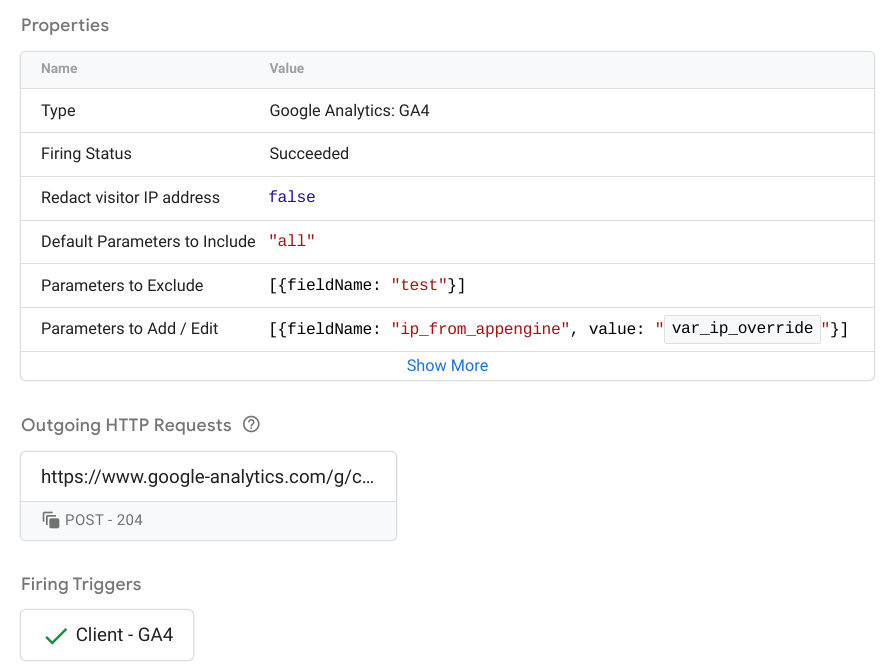
- 已触发的代码:事件已触发的代码。每个方框均会指明代码触发成功还是失败,以及代码的触发次数。
- 未触发的代码:未触发的可用代码。
点击任一方框均可查看代码属性、传出的 HTTP 请求和触发型触发器。
如需详细了解如何配置和实现服务器代码,请参阅如何构建服务器代码。
调试变量
变量标签页会列出事件的变量,其中包括变量类型、返回值类型以及值。例如,下方 user-engagement 事件的屏幕截图显示 var_screen_resolution 变量已被设置为“1536x864”。
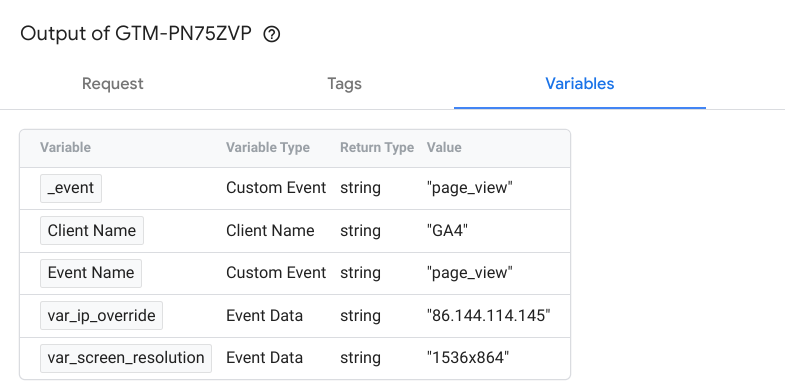
事件数据标签页会显示用于设置变量值的数据。
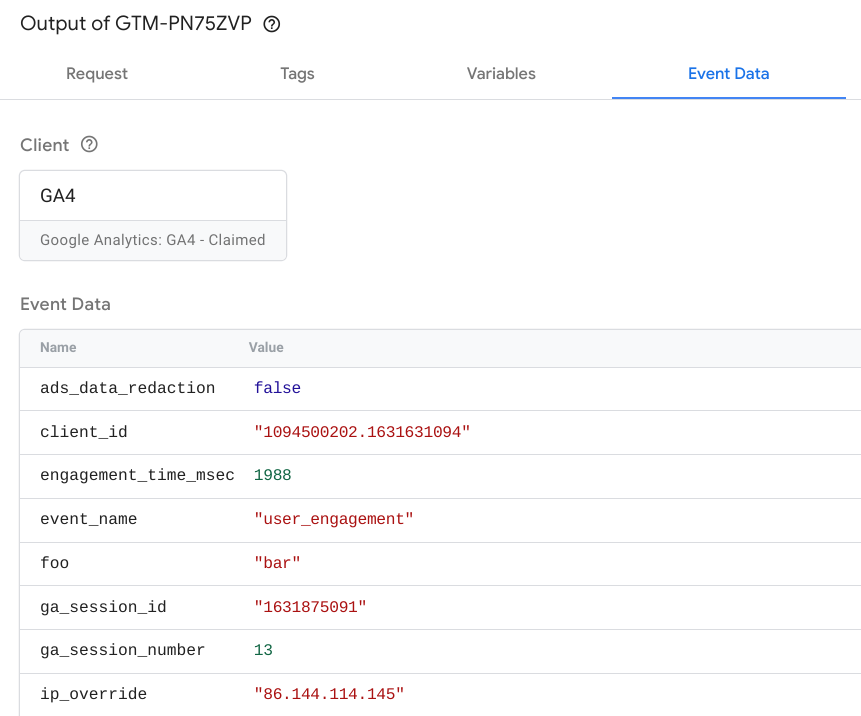
调试事件数据
事件数据标签页会显示事件的完整详细信息。这些数据用于设置变量标签页上显示的变量值。
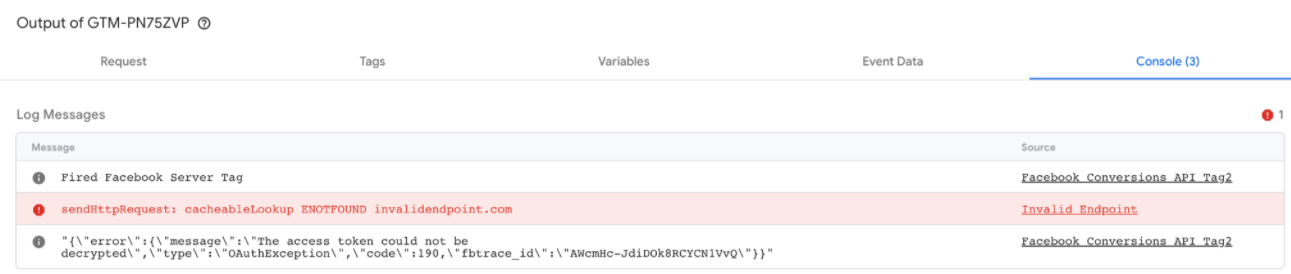
控制台
控制台标签页会显示源自已触发代码的所有错误。日志包含每条错误消息及其来源,例如无效端点或目标 API 调用。