Chrome Geliştirici Araçları ile Etkileşimli Tuval web uygulamanızdaki hataları ayıklayın
Koleksiyonlar ile düzeninizi koruyun
İçeriği tercihlerinize göre kaydedin ve kategorilere ayırın.
Chrome Geliştirici Araçları'nı kullanarak Etkileşimli Tuval web uygulamanızdaki hataları ayıklayabilirsiniz. Chrome hata ayıklayıcı, yazılım sürümü 30 veya üzeri (bu güncelleme Ekim 2020'de kullanıma sunulmaya başlanır) ve Cast donanım yazılımı sürümü 1.50 veya üzeri olan Google Home veya Google Nest akıllı ekranlarında desteklenir. Akıllı ekranınızda System settings / About device altındaki sürümleri kontrol edebilirsiniz.
Ortamınızı ayarlama
Hata ayıklama işlemi yapmadan önce, ortamınızı doğru şekilde ayarlamak için aşağıdakileri yapın:
Actions konsolu simülatöründe test etmek için İşleminizi etkinleştirin.
Makinenizi test ettiğiniz Google Home veya Google Nest
cihazla aynı yerel ağa bağlayın.
Ağınızın cihazlar arasında paketleri engellemediğinden emin olun.
Actions konsolunda ve Google Home veya Google Nest cihazda
aynı Google hesabıyla giriş yapın.
Ortamınız hazır olduğunda İşleminizi test akıllı ekranınızda başlatabilirsiniz.
Canvas web uygulamasını hata ayıklayıcıya bağlama
Canvas web uygulamanızı Chrome Geliştirici Araçları hata ayıklayıcısına bağlamak için aşağıdaki adımları uygulayın:
Chrome denetleyicisini başlatmak için Chrome tarayıcınızın adres alanına chrome://inspect#devices yazın. Sayfada cihazların bir listesi gösterilir. Kanvas HTML URL'si, test amaçlı Google Home veya Google Nest cihazınızın adının altında listelenmelidir. Chrome'un ağınızdaki tüm cihazları
keşfetmesinin biraz zaman alabileceğini unutmayın.
Chrome Geliştirici Araçları'nı başlatmak için HTML URL'sinin altındaki inspect bağlantısını tıklayın.
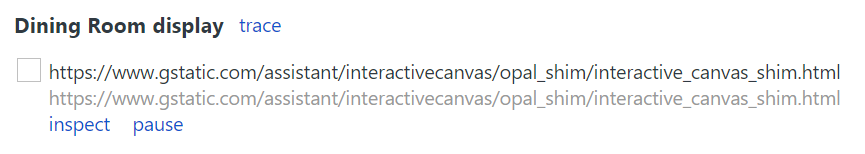
Chrome Geliştirici Araçları kendi penceresinde yüklenir. Cihazda oluşturulan web GUI'sini görmek için ekran video kaydı () düğmesini tıklayabilirsiniz. Aşağıdaki ekran görüntüsünde, web uygulamanızın
Chrome Geliştirici Araçları'nda nasıl göründüğü gösterilmektedir:
Canvas web uygulamanızın bir iframe'de yüklendiğini unutmayın.
Hata ayıklamayla ilgili ipuçları
Hata ayıklama sırasında aşağıdaki ek ipuçlarını aklınızda bulundurun:
Yerel istek karşılama uygulaması kapsayıcınızı, geliştirme URL'nizdeki en son kodla yeniden yüklemek için Chrome Geliştirici Araçları'ndaki sayfayı yenileyin.
JavaScript uygulamanızın hatasız yüklendiğinden emin olun. Bunun için Geliştirici Araçları sayfasının konsol bölümüne göz atın.
Web uygulaması kodunuzda debugger; kullanarak kodunuza manuel kesme noktaları ekleyin.
Cihazınızı uzun bir süre boyunca chrome://inspect#devices içinde görmezseniz inceleme sayfasını yenileyin.
Akıllı ekran belleği sınırlı olduğundan, 200 MB'ı aşarsa web uygulamanız kilitlenebilir veya askıya alınabilir. Bellek sorunlarını gidermek için Bellek Sorunlarını Düzeltme eğiticisini izleyin.
Karşılama hataları için Actions on Google sunucuları tarafından webhook günlüklerinizden veya Stackdriver günlüklerinden webhook'a gönderilen isteklere bakın.
[null,null,["Son güncelleme tarihi: 2025-07-25 UTC."],[[["\u003cp\u003eDebug your Interactive Canvas web app using Chrome DevTools on Google Home or Nest smart displays running supported software and firmware versions.\u003c/p\u003e\n"],["\u003cp\u003eSet up your environment by enabling your Action for testing, connecting devices to the same network, ensuring network connectivity, and using the same Google account.\u003c/p\u003e\n"],["\u003cp\u003eConnect to the debugger by launching Chrome Inspector, locating your device and Canvas HTML URL, and clicking "inspect" to open DevTools.\u003c/p\u003e\n"],["\u003cp\u003eUtilize debugging tips such as refreshing the DevTools page, checking for JavaScript errors, adding breakpoints, and monitoring performance and memory usage.\u003c/p\u003e\n"],["\u003cp\u003eThird-party smart display devices are not supported for debugging Canvas web apps.\u003c/p\u003e\n"]]],[],null,["# Debug your Interactive Canvas web app with Chrome DevTools\n\nYou can debug your Interactive Canvas web app using [Chrome DevTools](https://developers.google.com/web/tools/chrome-devtools). The Chrome debugger\nis supported on Google Home or Google Nest smart displays with a software\nversion of 30 or later (this update starts rolling out in October 2020)\nand a Cast firmware version of 1.50 or later. You can\ncheck the versions under `System settings / About device` on your smart display.\n| **Note:** Debugging Canvas web apps on third-party smart display devices is not supported.\n\nSet up your environment\n-----------------------\n\nBefore you can debug, do the following to set up your environment correctly:\n\n- Enable your Action for testing in the Actions console [simulator](/assistant/conversational/build/projects#test_projects_in_the_simulator).\n- Connect your machine to the same local area network as the Google Home or Google Nest device you are testing.\n- Ensure that your network doesn't block packets between devices.\n- Log in with the same Google account on the Actions console and on the Google Home or Google Nest device.\n\nOnce your environment is ready, you can launch your Action on your test\nsmart display.\n| **Note:** You cannot debug your Canvas web app until you've launched your development Action on your test smart display.\n\nConnect Canvas web app to debugger\n----------------------------------\n\nTo connect your Canvas web app to the Chrome DevTools debugger, follow these\nsteps:\n\n1. In your local development machine, install and launch the [Google Chrome browser](https://www.google.com/chrome/).\n2. In the address field of your Chrome browser, enter `chrome://inspect#devices` to launch the Chrome inspector. You should see a list of devices on the page, and the Canvas HTML URL should be listed under the name of your test Google Home or Google Nest device. Note that it might take some time for Chrome to discover all the devices on your network.\n3. Click the `inspect` link under the HTML URL to launch Chrome DevTools.\n\nChrome DevTools loads in its own window. You can click the screencast\n()\nbutton to see the web GUI rendered on the device. The following screenshot shows\nhow your web app appears in Chrome DevTools:\n\nNote that your Canvas web app is loaded in an iframe.\n\nDebugging tips\n--------------\n\nKeep the following additional tips in mind during debugging:\n\n- Refresh the page in Chrome DevTools to reload your local fulfillment app container with the latest code from your development URL.\n- Check that your JavaScript app loads without errors. To do this, check the console section of the DevTools page.\n- Add manual breakpoints to your code by using `debugger;` within your web app code.\n- If you don't see your device in the `chrome://inspect#devices` for an extended period of time, refresh the inspect page.\n- To debug any performance issues, follow the [Get Started with Analyzing Runtime Performance tutorial](https://developers.google.com/web/tools/chrome-devtools/evaluate-performance).\n- Because the smart display memory is limited, your web app might crash or hang if it goes over 200MB. To debug any memory issues, follow the [Fix Memory Problems tutorial](https://developers.google.com/web/tools/chrome-devtools/memory-problems).\n- For any fulfillment errors, look at requests sent by Actions on Google servers to the webhook from your webhook logs or from Stackdriver logs."]]