Depurar seu app da Web de tela interativa com o Chrome DevTools
Mantenha tudo organizado com as coleções
Salve e categorize o conteúdo com base nas suas preferências.
É possível depurar seu app da Web de tela interativa usando o Chrome DevTools. O depurador do Chrome
é compatível com smart displays do Google Home ou Google Nest com a versão
30 ou mais recente do software (esta atualização começa a ser lançada em outubro de 2020)
e uma versão de firmware do Google Cast de 1.50 ou mais recente. Você pode
verificar as versões em System settings / About device no seu smart display.
configure seu ambiente
Antes de depurar, faça o seguinte para configurar o ambiente corretamente:
Ative sua ação para teste no simulador do Console do Actions.
Conecte a máquina à mesma rede local do dispositivo Google Home
ou Google Nest que você está testando.
Verifique se a rede não bloqueia pacotes entre dispositivos.
Faça login com a mesma Conta do Google no Console do Actions e
no dispositivo Google Home ou Google Nest.
Quando o ambiente estiver pronto, será possível iniciar a ação no smart display
de teste.
Conectar o app da Web Canvas ao depurador
Para conectar seu app da Web Canvas ao depurador do Chrome DevTools, siga estas
etapas:
No campo de endereço do navegador Chrome, insira chrome://inspect#devices
para iniciar o inspetor do Chrome. Uma lista de dispositivos vai aparecer
na página, e o URL HTML do Canvas aparecerá abaixo do nome do
dispositivo Google Home ou Google Nest de teste. Pode levar algum tempo para que
o Chrome descubra todos os dispositivos na sua rede.
Clique no link inspect abaixo do URL HTML para iniciar o Chrome DevTools.
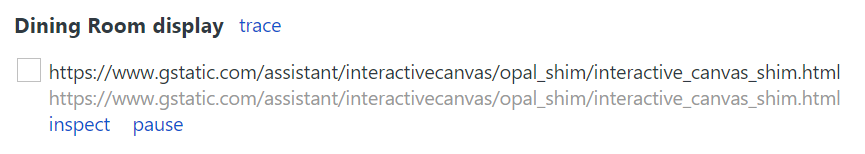
O Chrome DevTools é carregado na própria janela. Clique no botão de screencast
()
para conferir a GUI da Web renderizada no dispositivo. A captura de tela a seguir mostra
como seu app da Web aparece no Chrome DevTools:
Seu app da Web Canvas é carregado em um iframe.
Dicas de depuração
Lembre-se das seguintes dicas durante a depuração:
Atualize a página no Chrome DevTools para recarregar o contêiner do app de fulfillment local
com o código mais recente do URL de desenvolvimento.
Verifique se o app JavaScript carrega sem erros. Para isso, verifique a
seção de console da página do DevTools.
Adicione pontos de interrupção manuais ao código usando debugger; no código do app da Web.
Se o dispositivo não aparecer na chrome://inspect#devices por um período
longo, atualize a página de inspeção.
Como a memória do smart display é limitada, seu app da Web poderá falhar ou travar
se ultrapassar 200 MB. Para depurar problemas de memória, siga o tutorial Corrigir problemas de memória.
Para verificar se há erros de fulfillment, confira as solicitações enviadas pelos servidores do Actions on Google
para o webhook dos registros do webhook ou do Stackdriver.
[null,null,["Última atualização 2025-07-25 UTC."],[[["\u003cp\u003eDebug your Interactive Canvas web app using Chrome DevTools on Google Home or Nest smart displays running supported software and firmware versions.\u003c/p\u003e\n"],["\u003cp\u003eSet up your environment by enabling your Action for testing, connecting devices to the same network, ensuring network connectivity, and using the same Google account.\u003c/p\u003e\n"],["\u003cp\u003eConnect to the debugger by launching Chrome Inspector, locating your device and Canvas HTML URL, and clicking "inspect" to open DevTools.\u003c/p\u003e\n"],["\u003cp\u003eUtilize debugging tips such as refreshing the DevTools page, checking for JavaScript errors, adding breakpoints, and monitoring performance and memory usage.\u003c/p\u003e\n"],["\u003cp\u003eThird-party smart display devices are not supported for debugging Canvas web apps.\u003c/p\u003e\n"]]],[],null,["# Debug your Interactive Canvas web app with Chrome DevTools\n\nYou can debug your Interactive Canvas web app using [Chrome DevTools](https://developers.google.com/web/tools/chrome-devtools). The Chrome debugger\nis supported on Google Home or Google Nest smart displays with a software\nversion of 30 or later (this update starts rolling out in October 2020)\nand a Cast firmware version of 1.50 or later. You can\ncheck the versions under `System settings / About device` on your smart display.\n| **Note:** Debugging Canvas web apps on third-party smart display devices is not supported.\n\nSet up your environment\n-----------------------\n\nBefore you can debug, do the following to set up your environment correctly:\n\n- Enable your Action for testing in the Actions console [simulator](/assistant/conversational/build/projects#test_projects_in_the_simulator).\n- Connect your machine to the same local area network as the Google Home or Google Nest device you are testing.\n- Ensure that your network doesn't block packets between devices.\n- Log in with the same Google account on the Actions console and on the Google Home or Google Nest device.\n\nOnce your environment is ready, you can launch your Action on your test\nsmart display.\n| **Note:** You cannot debug your Canvas web app until you've launched your development Action on your test smart display.\n\nConnect Canvas web app to debugger\n----------------------------------\n\nTo connect your Canvas web app to the Chrome DevTools debugger, follow these\nsteps:\n\n1. In your local development machine, install and launch the [Google Chrome browser](https://www.google.com/chrome/).\n2. In the address field of your Chrome browser, enter `chrome://inspect#devices` to launch the Chrome inspector. You should see a list of devices on the page, and the Canvas HTML URL should be listed under the name of your test Google Home or Google Nest device. Note that it might take some time for Chrome to discover all the devices on your network.\n3. Click the `inspect` link under the HTML URL to launch Chrome DevTools.\n\nChrome DevTools loads in its own window. You can click the screencast\n()\nbutton to see the web GUI rendered on the device. The following screenshot shows\nhow your web app appears in Chrome DevTools:\n\nNote that your Canvas web app is loaded in an iframe.\n\nDebugging tips\n--------------\n\nKeep the following additional tips in mind during debugging:\n\n- Refresh the page in Chrome DevTools to reload your local fulfillment app container with the latest code from your development URL.\n- Check that your JavaScript app loads without errors. To do this, check the console section of the DevTools page.\n- Add manual breakpoints to your code by using `debugger;` within your web app code.\n- If you don't see your device in the `chrome://inspect#devices` for an extended period of time, refresh the inspect page.\n- To debug any performance issues, follow the [Get Started with Analyzing Runtime Performance tutorial](https://developers.google.com/web/tools/chrome-devtools/evaluate-performance).\n- Because the smart display memory is limited, your web app might crash or hang if it goes over 200MB. To debug any memory issues, follow the [Fix Memory Problems tutorial](https://developers.google.com/web/tools/chrome-devtools/memory-problems).\n- For any fulfillment errors, look at requests sent by Actions on Google servers to the webhook from your webhook logs or from Stackdriver logs."]]