Esegui il debug della tua app web interattiva Canvas con Chrome DevTools
Mantieni tutto organizzato con le raccolte
Salva e classifica i contenuti in base alle tue preferenze.
Puoi eseguire il debug dell'app web Interactive Canvas utilizzando Chrome DevTools. Il debugger di Chrome
è supportato sugli smart display Google Home o Google Nest con versione software 30 o successiva (questo aggiornamento sarà implementato a ottobre 2020)
e su una versione del firmware di Google Cast 1.50 o successiva. Puoi
controllare le versioni in System settings / About device sul tuo smart display.
Configura l'ambiente
Prima di eseguire il debug, segui questi passaggi per configurare correttamente l'ambiente:
Attiva l'Azione per i test nel simulatore della console Actions.
Collega il dispositivo alla stessa LAN a cui è collegato il dispositivo Google Home
o Google Nest che stai testando.
Assicurati che la tua rete non blocchi i pacchetti tra i dispositivi.
Accedi con lo stesso Account Google nella console Actions e sul dispositivo Google Home o Google Nest.
Quando l'ambiente è pronto, puoi avviare l'azione sullo smart display di prova.
Collega l'app web Canvas al debugger
Per collegare l'app web Canvas al debugger di Chrome DevTools, segui questi passaggi:
Nel campo dell'indirizzo del browser Chrome, inserisci chrome://inspect#devices per avviare Chrome Inspector. Nella pagina dovresti visualizzare un elenco di dispositivi e l'URL HTML di Canvas dovrebbe essere elencato sotto il nome del tuo dispositivo Google Home o Google Nest di prova. Tieni presente che potrebbe essere necessario un po' di tempo
prima che Chrome rilevi tutti i dispositivi in rete.
Fai clic sul link inspect sotto l'URL HTML per avviare Chrome DevTools.
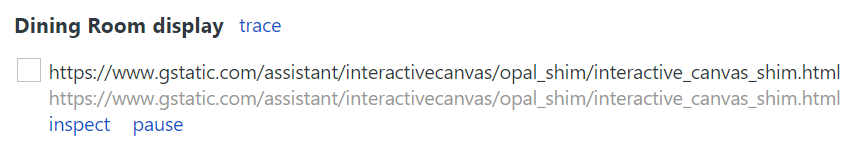
Chrome DevTools viene caricato in una finestra separata. Puoi fare clic sul pulsante dello screencast () per visualizzare la GUI web visualizzata sul dispositivo. Il seguente screenshot mostra come viene visualizzata l'app web in Chrome DevTools:
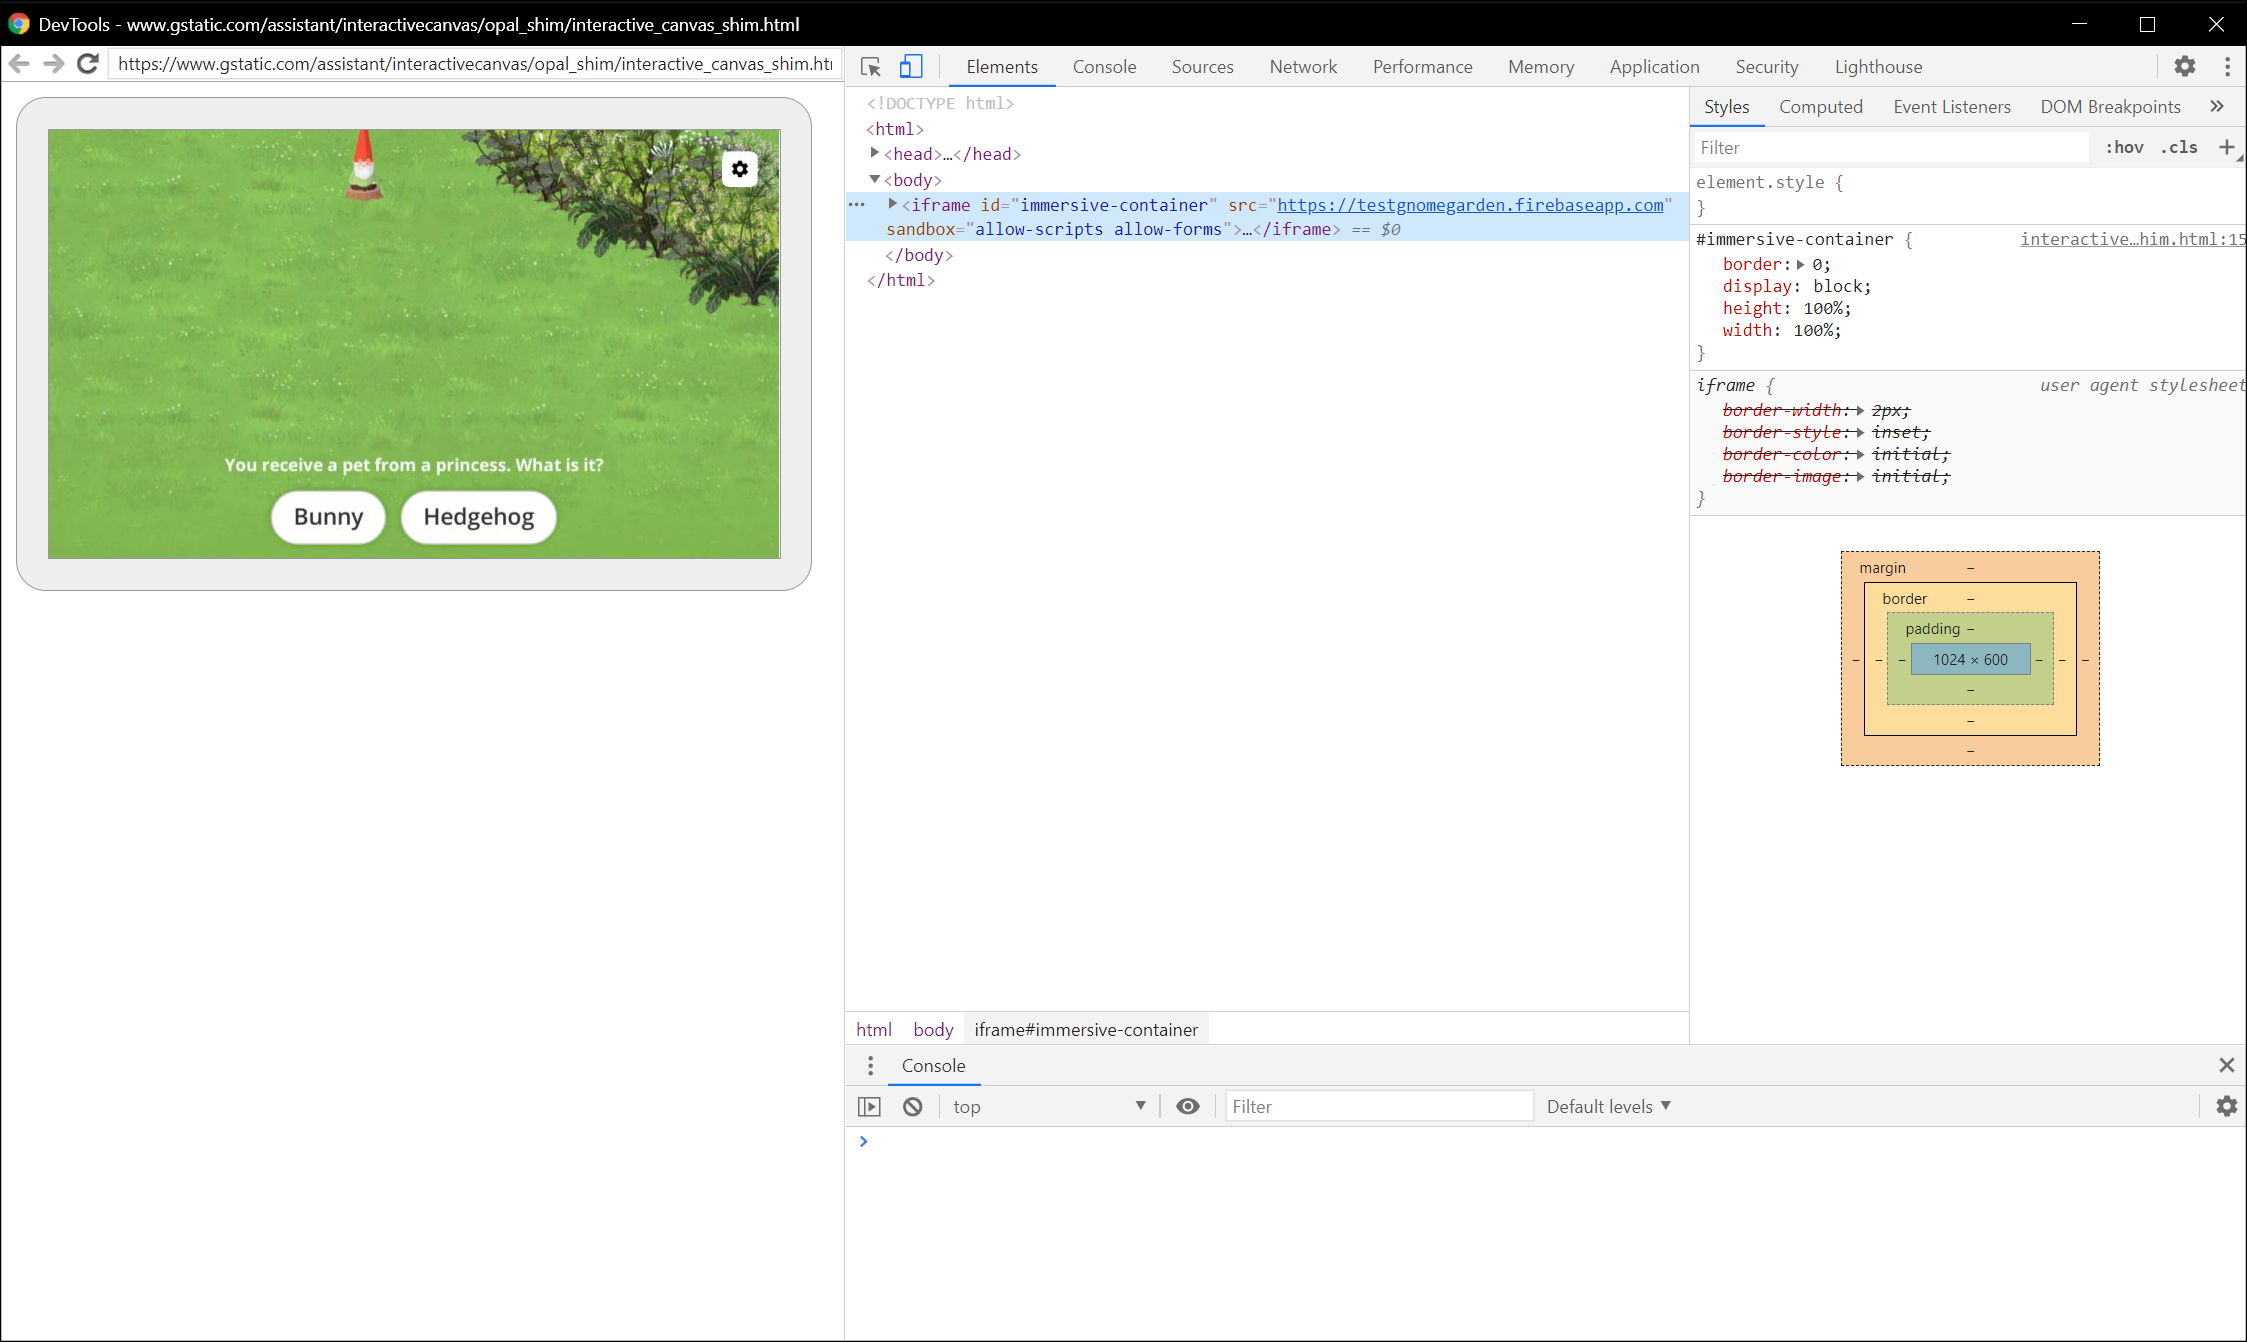
Tieni presente che l'app web Canvas viene caricata in un iframe.
Suggerimenti di debug
Durante il debug, tieni presente i seguenti suggerimenti aggiuntivi:
Aggiorna la pagina in Chrome DevTools per ricaricare il contenitore dell'app di distribuzione locale con il codice più recente dell'URL di sviluppo.
Verifica che l'app JavaScript venga caricata senza errori. Per farlo, controlla la sezione
console della pagina DevTools.
Aggiungi punti di interruzione manuali al codice utilizzando debugger; all'interno del
codice dell'app web.
Se non vedi il tuo dispositivo in chrome://inspect#devices per un periodo di tempo prolungato, aggiorna la pagina di ispezione.
Poiché la memoria dello smart display è limitata, l'app web potrebbe arrestarsi in modo anomalo o bloccarsi se supera i 200 MB. Per eseguire il debug di eventuali problemi di memoria, segui il tutorial per risolvere i problemi di memoria.
Per eventuali errori di fulfillment, esamina le richieste inviate dai server Actions on Google al webhook dai log dei webhook o dai log di Stackdriver.
[null,null,["Ultimo aggiornamento 2025-07-25 UTC."],[[["\u003cp\u003eDebug your Interactive Canvas web app using Chrome DevTools on Google Home or Nest smart displays running supported software and firmware versions.\u003c/p\u003e\n"],["\u003cp\u003eSet up your environment by enabling your Action for testing, connecting devices to the same network, ensuring network connectivity, and using the same Google account.\u003c/p\u003e\n"],["\u003cp\u003eConnect to the debugger by launching Chrome Inspector, locating your device and Canvas HTML URL, and clicking "inspect" to open DevTools.\u003c/p\u003e\n"],["\u003cp\u003eUtilize debugging tips such as refreshing the DevTools page, checking for JavaScript errors, adding breakpoints, and monitoring performance and memory usage.\u003c/p\u003e\n"],["\u003cp\u003eThird-party smart display devices are not supported for debugging Canvas web apps.\u003c/p\u003e\n"]]],[],null,["# Debug your Interactive Canvas web app with Chrome DevTools\n\nYou can debug your Interactive Canvas web app using [Chrome DevTools](https://developers.google.com/web/tools/chrome-devtools). The Chrome debugger\nis supported on Google Home or Google Nest smart displays with a software\nversion of 30 or later (this update starts rolling out in October 2020)\nand a Cast firmware version of 1.50 or later. You can\ncheck the versions under `System settings / About device` on your smart display.\n| **Note:** Debugging Canvas web apps on third-party smart display devices is not supported.\n\nSet up your environment\n-----------------------\n\nBefore you can debug, do the following to set up your environment correctly:\n\n- Enable your Action for testing in the Actions console [simulator](/assistant/conversational/build/projects#test_projects_in_the_simulator).\n- Connect your machine to the same local area network as the Google Home or Google Nest device you are testing.\n- Ensure that your network doesn't block packets between devices.\n- Log in with the same Google account on the Actions console and on the Google Home or Google Nest device.\n\nOnce your environment is ready, you can launch your Action on your test\nsmart display.\n| **Note:** You cannot debug your Canvas web app until you've launched your development Action on your test smart display.\n\nConnect Canvas web app to debugger\n----------------------------------\n\nTo connect your Canvas web app to the Chrome DevTools debugger, follow these\nsteps:\n\n1. In your local development machine, install and launch the [Google Chrome browser](https://www.google.com/chrome/).\n2. In the address field of your Chrome browser, enter `chrome://inspect#devices` to launch the Chrome inspector. You should see a list of devices on the page, and the Canvas HTML URL should be listed under the name of your test Google Home or Google Nest device. Note that it might take some time for Chrome to discover all the devices on your network.\n3. Click the `inspect` link under the HTML URL to launch Chrome DevTools.\n\nChrome DevTools loads in its own window. You can click the screencast\n()\nbutton to see the web GUI rendered on the device. The following screenshot shows\nhow your web app appears in Chrome DevTools:\n\nNote that your Canvas web app is loaded in an iframe.\n\nDebugging tips\n--------------\n\nKeep the following additional tips in mind during debugging:\n\n- Refresh the page in Chrome DevTools to reload your local fulfillment app container with the latest code from your development URL.\n- Check that your JavaScript app loads without errors. To do this, check the console section of the DevTools page.\n- Add manual breakpoints to your code by using `debugger;` within your web app code.\n- If you don't see your device in the `chrome://inspect#devices` for an extended period of time, refresh the inspect page.\n- To debug any performance issues, follow the [Get Started with Analyzing Runtime Performance tutorial](https://developers.google.com/web/tools/chrome-devtools/evaluate-performance).\n- Because the smart display memory is limited, your web app might crash or hang if it goes over 200MB. To debug any memory issues, follow the [Fix Memory Problems tutorial](https://developers.google.com/web/tools/chrome-devtools/memory-problems).\n- For any fulfillment errors, look at requests sent by Actions on Google servers to the webhook from your webhook logs or from Stackdriver logs."]]