Google グラフの使用
コレクションでコンテンツを整理
必要に応じて、コンテンツの保存と分類を行います。
Google グラフを使用すると、ウェブサイト上のデータを可視化できます。
グラフ ギャラリーには、シンプルな折れ線グラフから複雑な階層ツリーマップまで、すぐに使用できる多数のグラフタイプが用意されています。
Google Chart を使用する最も一般的な方法は、ウェブページに埋め込む簡単な JavaScript を使用する方法です。いくつかの Google Chart ライブラリを読み込み、グラフ化するデータをリストして、グラフをカスタマイズするオプションを選択し、最後に選択した id でグラフ オブジェクトを作成します。
次に、そのウェブページの <div> に、この id を指定して Google グラフを表示します。
スタートガイドをご覧ください。
グラフは JavaScript クラスとして公開されます。Google グラフでは、さまざまなグラフの種類を使用できます。通常はデフォルトのデザインで十分ですが、ウェブサイトの外観に合わせてグラフをカスタマイズできます。グラフは高度にインタラクティブなもので、イベントを公開することで、複雑なダッシュボードの作成や、ウェブページに統合されたウェブサイト エクスペリエンスの構築が可能になります。グラフは、HTML5/SVG 技術を使用してレンダリングされ、ブラウザ間互換性(古い IE バージョンの VML を含む)と、iPhone、iPad、Android へのクロス プラットフォーム ポータビリティを提供します。ユーザーがプラグインやソフトウェアに手を加える必要はありません。
ウェブブラウザがあればグラフを見ることができます。
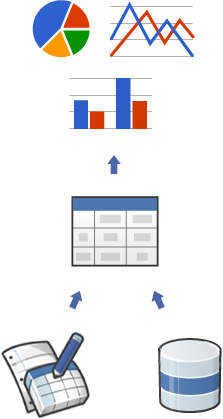
すべてのグラフタイプは DataTable クラスを使用してデータが取り込まれるため、テストをする際に最適なグラフタイプを簡単に切り替えることができます。DataTable は、データの並べ替え、変更、フィルタリングを行うメソッドを提供し、ウェブページ、データベース、または Chart Tools Datasource プロトコルをサポートする任意のデータ プロバイダから直接入力できます。(このプロトコルは SQL に似たクエリ言語で、Google スプレッドシート、Google Fusion Tables、SalesForce などのサードパーティのデータ プロバイダが実装しています。独自のプロトコルを実装して、他のサービスのデータ プロバイダにすることもできます。)
最初のグラフを作成する準備はできましたか?クイックスタートをご覧ください。
Google のツールはお客様のニーズに応えるため、絶えず進化を続けています。皆様からのフィードバックは、どの機能を優先的に使用するかの判断材料となります。
ヘルプグループにご参加ください。
特に記載のない限り、このページのコンテンツはクリエイティブ・コモンズの表示 4.0 ライセンスにより使用許諾されます。コードサンプルは Apache 2.0 ライセンスにより使用許諾されます。詳しくは、Google Developers サイトのポリシーをご覧ください。Java は Oracle および関連会社の登録商標です。
最終更新日 2024-07-10 UTC。
[null,null,["最終更新日 2024-07-10 UTC。"],[[["\u003cp\u003eGoogle Charts offers a wide variety of interactive and customizable chart types to visualize data on your website.\u003c/p\u003e\n"],["\u003cp\u003eEmbedding charts is straightforward using simple JavaScript that loads libraries, specifies data, customizes options, and creates a chart object within a div element.\u003c/p\u003e\n"],["\u003cp\u003eCharts are highly interactive, supporting events, dashboards, and integration with web pages for enhanced user experiences.\u003c/p\u003e\n"],["\u003cp\u003eGoogle Charts uses HTML5/SVG technology for cross-browser and cross-platform compatibility, ensuring accessibility for all users.\u003c/p\u003e\n"],["\u003cp\u003eData population is handled by the DataTable class, enabling easy switching between chart types and providing methods for data manipulation and sourcing.\u003c/p\u003e\n"]]],[],null,["# Using Google Charts\n\nGoogle Charts provides a perfect way to visualize data on your website.\nFrom simple line charts to complex hierarchical tree maps, the\n[chart gallery](/chart/interactive/docs/gallery)\nprovides a large number of ready-to-use chart types.\n\nThe most common way to use Google Charts is with simple JavaScript\nthat you embed in your web page. You load some Google Chart libraries,\nlist the data to be charted, select options to customize your chart,\nand finally create a chart object with an id that you choose.\nThen, later in the web page, you create a \\\u003cdiv\\\u003e\nwith that id to display the Google Chart.\n\nThat's all you need to [get started](/chart/interactive/docs/quick_start).\n\nCharts are exposed as JavaScript classes, and Google Charts provides\n[many chart types](/chart/interactive/docs/gallery) for you to use.\nThe default appearance will usually be all you need, and you can always\n[customize a chart](/chart/interactive/docs/customizing_charts)\nto fit the look and feel of your website. Charts are highly interactive and expose\n[events](/chart/interactive/docs/events) that let you connect them to create complex\n[dashboards](/chart/interactive/docs/gallery/controls) or other experiences\n[integrated with your\nwebpage](/chart/interactive/docs/examples#full_html_page_example).\nCharts are rendered using HTML5/SVG technology to provide cross-browser compatibility\n(including VML for older IE versions) and cross platform portability to iPhones,\niPads, and Android. Your users will never have to mess with plugins or any software.\nIf they have a web browser, they can see your charts.\n\nAll chart types are populated with data using the\n[DataTable](/chart/interactive/docs/reference#DataTable) class,\nmaking it easy to switch between chart types as you experiment to find the ideal appearance.\nThe DataTable provides methods for sorting, modifying, and filtering data, and can be\npopulated directly from your web page, a database, or any data provider supporting the\n[Chart Tools Datasource](/chart/interactive/docs/queries) protocol.\n(That protocol includes a SQL-like query language and is implemented by Google Spreadsheets,\nGoogle Fusion Tables and third party data providers such as SalesForce.\nYou can even implement the protocol on your own website and become a data provider\nfor other services.)\n\n**Ready to create your first chart? Visit the\n[quickstart](/chart/interactive/docs/quick_start).**\n\nOur tools are constantly evolving to better address your needs;\nwe depend on your feedback to help us prioritize which features to include.\nJoin our [discussion group](http://groups.google.com/group/google-visualization-api)."]]