Page Summary
-
The ALOS Landform dataset provides landform classes based on combined CHILI and mTPI datasets, derived from USGS's 10m NED DEM.
-
The data, developed by Conservation Science Partners (CSP), provides detailed, multi-scale information on landforms and physiographic patterns for climate adaptation planning.
-
The dataset includes one band, "constant," with a pixel size of 10 meters, representing NED-derived landform classes.
-
The dataset's terms of use are CC-BY-NC-SA-4.0.
-
The dataset was available from 2006-01-24T00:00:00Z to 2011-05-13T00:00:00Z.
- Dataset Availability
- 2006-01-24T00:00:00Z–2011-05-13T00:00:00Z
- Dataset Producer
- Conservation Science Partners
- Tags
Description
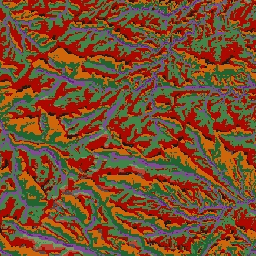
The ALOS Landform dataset provides landform classes created by combining the Continuous Heat-Insolation Load Index (CHILI) and the multi-scale Topographic Position Index (mTPI) datasets. It is based on the USGS's 10m NED DEM (available in EE as USGS/NED).
The Conservation Science Partners (CSP) Ecologically Relevant Geomorphology (ERGo) Datasets, Landforms and Physiography contain detailed, multi-scale data on landforms and physiographic (aka land facet) patterns. Although there are many potential uses of these data, the original purpose for these data was to develop an ecologically relevant classification and map of landforms and physiographic classes that are suitable for climate adaptation planning. Because there is large uncertainty associated with future climate conditions and even more uncertainty around ecological responses, providing information about what is unlikely to change offers a strong foundation for managers to build robust climate adaptation plans. The quantification of these features of the landscape is sensitive to the resolution, so we provide the highest resolution possible given the extent and characteristics of a given index.
Bands
Bands
Pixel size: 10 meters (all bands)
| Name | Pixel Size | Description |
|---|---|---|
constant |
10 meters | NED-derived landform classes |
constant Class Table
| Value | Color | Description |
|---|---|---|
| 11 | #141414 | Peak/ridge (warm) |
| 12 | #383838 | Peak/ridge |
| 13 | #808080 | Peak/ridge (cool) |
| 14 | #ebeb8f | Mountain/divide |
| 15 | #f7d311 | Cliff |
| 21 | #aa0000 | Upper slope (warm) |
| 22 | #d89382 | Upper slope |
| 23 | #ddc9c9 | Upper slope (cool) |
| 24 | #dccdce | Upper slope (flat) |
| 31 | #1c6330 | Lower slope (warm) |
| 32 | #68aa63 | Lower slope |
| 33 | #b5c98e | Lower slope (cool) |
| 34 | #e1f0e5 | Lower slope (flat) |
| 41 | #a975ba | Valley |
| 42 | #6f198c | Valley (narrow) |
Terms of Use
Terms of Use
Citations
Theobald, D. M., Harrison-Atlas, D., Monahan, W. B., & Albano, C. M. (2015). Ecologically-relevant maps of landforms and physiographic diversity for climate adaptation planning. PloS one, 10(12), e0143619
Explore with Earth Engine
Code Editor (JavaScript)
var dataset = ee.Image('CSP/ERGo/1_0/US/landforms');
var landforms = dataset.select('constant');
var landformsVis = {
  min: 11.0,
  max: 42.0,
  palette: [
    '141414', '383838', '808080', 'ebeb8f', 'f7d311', 'aa0000', 'd89382',
    'ddc9c9', 'dccdce', '1c6330', '68aa63', 'b5c98e', 'e1f0e5', 'a975ba',
    '6f198c'
  ],
};
Map.setCenter(-105.58, 40.5498, 11);
Map.addLayer(landforms, landformsVis, 'Landforms');