- 数据集可用性
- 1975-01-01T00:00:00Z–2030-12-31T00:00:00Z
- 数据集提供商
- 欧盟 JRC
- 标签
说明
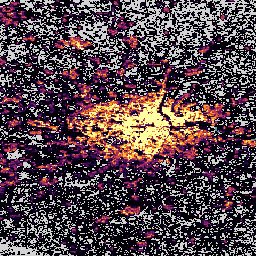
此栅格数据集描绘了居住人口的空间分布,以单元格的绝对居民人数表示。 1975 年至 2020 年间以 5 年为间隔的居住人口估计值以及根据 CIESIN GPWv4.11 得出的 2025 年和 2030 年预测值,根据每个时间段内全球 GHSL 建成区地表层中绘制的建成区分布、体积和分类,从普查或行政单位分解为网格单元。
如需详细了解 GHSL 主要产品,请参阅 GHSL 数据包 2023 年报告
全球人居层 (GHSL) 项目由欧盟委员会、联合研究中心以及区域和城市政策总局提供支持。
频段
像素尺寸
100 米
频段
| 名称 | 像素尺寸 | 说明 |
|---|---|---|
population_count |
米 | 按历元划分的人口数量 |
使用条款
使用条款
GHSL 由欧盟委员会联合研究中心制作,属于开放且免费的数据。只要注明来源,即可重复使用。如需了解详情,请参阅使用条件(欧盟委员会再利用和版权声明)。
引用
数据集:Schiavina, Marcello;Freire, Sergio;Alessandra Carioli;MacManus, Kytt (2023):GHS-POP R2023A - GHS 人口网格,多时相数据 (1975-2030)。欧盟委员会,联合研究中心 (JRC) PID:http://data.europa.eu/89h/2ff68a52-5b5b-4a22-8f40-c41da8332cfe doi:10.2905/2FF68A52-5B5B-4A22-8F40-C41DA8332CFE
方法:Pesaresi、Martino、Marcello Schiavina、Panagiotis Politis、Sergio Freire、Katarzyna Krasnodebska、Johannes H. Uhl、Alessandra Carioli 等 (2024)。通过联合评估地球观测和人口调查数据,对全球人类住区层进行了改进。International Journal of Digital Earth 17(1). doi:10.1080/17538947.2024.2390454.
DOI
使用 Earth Engine 探索
代码编辑器 (JavaScript)
var baseChange =
    [{featureType: 'all', stylers: [{saturation: -100}, {lightness: 45}]}];
Map.setOptions('baseChange', {'baseChange': baseChange});
var image1975 = ee.Image('JRC/GHSL/P2023A/GHS_POP/1975');
var image1990 = ee.Image('JRC/GHSL/P2023A/GHS_POP/1990');
var image2020 = ee.Image('JRC/GHSL/P2023A/GHS_POP/2020');
var populationCountVis = {
  min: 0.0,
  max: 100.0,
  palette:
      ['000004', '320A5A', '781B6C', 'BB3654', 'EC6824', 'FBB41A', 'FCFFA4']
};
Map.setCenter(8, 48, 7);
image1975 = image1975.updateMask(image1975.gt(0));
image1990 = image1990.updateMask(image1990.gt(0));
image2020 = image2020.updateMask(image2020.gt(0));
Map.addLayer(image1975, populationCountVis, 'Population count, 1975');
Map.addLayer(image1990, populationCountVis, 'Population count, 1990');
Map.addLayer(image2020, populationCountVis, 'Population count, 2020');
