Page Summary
-
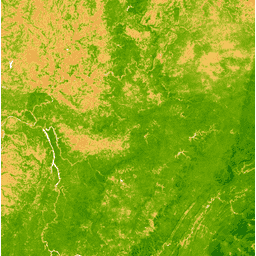
The Enhanced Vegetation Index (EVI) is generated from Near-IR, Red, and Blue bands and ranges from -1.0 to 1.0.
-
This dataset is available from 2000-02-24 to 2023-02-10 with a daily cadence.
-
MODIS data and products have no restrictions on subsequent use, sale, or redistribution.
-
The data can be explored using Google Earth Engine, which is free for research, education, and nonprofit use.
- Dataset Availability
- 2000-02-24T00:00:00Z–2023-02-10T00:00:00Z
- Dataset Producer
- Cadence
- 1 Day
- Tags
Description
The Enhanced Vegetation Index (EVI) is generated from the Near-IR, Red and Blue bands of each scene, and ranges in value from -1.0 to 1.0. See Huete et al. (2002) for details. This product is generated from the MODIS/006/MCD43A4 surface reflectance composites.
Bands
Bands
Pixel size: 463.313 meters (all bands)
| Name | Pixel Size | Description |
|---|---|---|
EVI |
463.313 meters | Enhanced Vegetation Index |
Terms of Use
Terms of Use
MODIS data and products acquired through the LP DAAC have no restrictions on subsequent use, sale, or redistribution.
Explore with Earth Engine
Code Editor (JavaScript)
var dataset = ee.ImageCollection('MODIS/MCD43A4_006_EVI')
                  .filter(ee.Filter.date('2018-04-01', '2018-06-01'));
var colorized = dataset.select('EVI');
var colorizedVis = {
  min: 0,
  max: 1,
  palette: [
    'ffffff', 'ce7e45', 'df923d', 'f1b555', 'fcd163', '99b718', '74a901',
    '66a000', '529400', '3e8601', '207401', '056201', '004c00', '023b01',
    '012e01', '011d01', '011301'
  ],
};
Map.setCenter(-7.03125, 31.0529339857, 2);
Map.addLayer(colorized, colorizedVis, 'Colorized');