Page Summary
-
This dataset provides predicted probabilities of USDA soil great groups at a 250m resolution based on machine learning and global soil profile data.
-
The data is available for the period between 1950 and 2018.
-
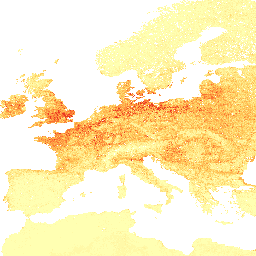
The dataset includes a band named 'grtgroup' representing the predicted Hapludalfs probability in percentage.
-
The terms of use for this dataset are specified as CC-BY-SA-4.0.
- Dataset Availability
- 1950-01-01T00:00:00Z–2018-01-01T00:00:00Z
- Dataset Producer
- EnvirometriX Ltd
- Tags
Description
Predicted USDA soil great groups at 250 m (probabilities).
Distribution of the USDA soil great groups based on machine learning predictions from global compilation of soil profiles. To learn more about soil great groups please refer to the Illustrated Guide to Soil Taxonomy - NRCS - USDA.
- Processing steps are described in detail here
- Antarctica is not included.
To access and visualize maps outside of Earth Engine, use this page.
If you discover a bug, artifact or inconsistency in the LandGIS maps or if you have a question please use the following channels:
Bands
Bands
Pixel size: 250 meters (all bands)
| Name | Units | Min | Max | Pixel Size | Description |
|---|---|---|---|---|---|
grtgroup |
% | 0* | 35* | 250 meters | Predicted Hapludalfs probability |
Terms of Use
Terms of Use
Citations
Tomislav Hengl, & Travis Nauman. (2018). Predicted USDA soil great groups at 250 m (probabilities) (Version v01) [Data set]. Zenodo. 10.5281/zenodo.1476844
DOIs
Explore with Earth Engine
Code Editor (JavaScript)
var dataset = ee.Image('OpenLandMap/SOL/SOL_GRTGROUP_USDA-SOILTAX-HAPLUDALFS_P/v01');

var visualization = {
  bands: ['grtgroup'],
  min: 0.0,
  max: 35.0,
  palette: ['ffffb2', 'fecc5c', 'fd8d3c', 'f03b20', 'bd0026']
};

Map.centerObject(dataset);

Map.addLayer(dataset, visualization, 'Hapludalfs');