- 目录所有者
- Awesome GEE Community Catalog
- 数据集可用时间
- 2000-01-01T00:00:00Z–2023-12-31T00:00:00Z
- 数据集生产者
- Oak Ridge National Laboratory
- 标签
说明
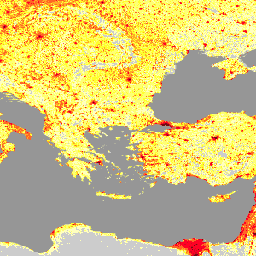
LandScan 数据集由橡树岭国家实验室 (ORNL) 提供,是一个全面且高分辨率的全球人口分布数据集,可作为各种应用的宝贵资源。LandScan 采用先进的空间建模技术和地理空间数据源,以 30 角秒的分辨率提供有关人口数量和密度的详细信息,从而能够准确且及时地了解全球的人类居住模式。LandScan 具有高准确性和精细度,可为城市规划、灾难响应、流行病学和环境研究等多个领域提供支持,是决策者和研究人员了解和应对全球各种社会和环境挑战的必备工具。
频段
波段
像素大小:1,000 米(所有波段)
| 名称 | 最小值 | 最大值 | 像素大小 | 说明 |
|---|---|---|---|---|
b1 |
0* | 21171* | 1000 米 | 估计的人口数 |
使用条款
使用条款
Landscan 数据集已获得知识共享署名 4.0 国际版许可。用户可以出于商业和非商业目的自由使用、复制、分发、传播和改编本作品,不受任何限制,但前提是明确注明来源。
引用
引用:
Sims, K.、Reith, A.、Bright, E.、Kaufman, J.、Pyle, J.、Epting, J.、Gonzales, J.,Adams, D.、Powell, E.、Urban, M.、& Rose, A. (2023 年)。LandScan Global 2022 [数据集]。Oak Ridge National Laboratory. https://doi.org/10.48690/1529167
DOI
通过 Earth Engine 探索
代码编辑器 (JavaScript)
var landscan_global =
    ee.ImageCollection('projects/sat-io/open-datasets/ORNL/LANDSCAN_GLOBAL');
var popcount_intervals = '<RasterSymbolizer>' +
    ' <ColorMap type="intervals" extended="false" >' +
    '<ColorMapEntry color="#CCCCCC" quantity="0" label="No Data"/>' +
    '<ColorMapEntry color="#FFFFBE" quantity="5" label="Population Count (Estimate)"/>' +
    '<ColorMapEntry color="#FEFF73" quantity="25" label="Population Count (Estimate)"/>' +
    '<ColorMapEntry color="#FEFF2C" quantity="50" label="Population Count (Estimate)"/>' +
    '<ColorMapEntry color="#FFAA27" quantity="100" label="Population Count (Estimate)"/>' +
    '<ColorMapEntry color="#FF6625" quantity="500" label="Population Count (Estimate)"/>' +
    '<ColorMapEntry color="#FF0023" quantity="2500" label="Population Count (Estimate)"/>' +
    '<ColorMapEntry color="#CC001A" quantity="5000" label="Population Count (Estimate)"/>' +
    '<ColorMapEntry color="#730009" quantity="185000" label="Population Count (Estimate)"/>' +
    '</ColorMap>' +
    '</RasterSymbolizer>';

// Define a dictionary which will be used to make legend and visualize image on
// map
var dict = {
  'names': [
    '0', '1-5', '6-25', '26-50', '51-100', '101-500', '501-2500', '2501-5000',
    '5001-185000'
  ],
  'colors': [
    '#CCCCCC', '#FFFFBE', '#FEFF73', '#FEFF2C', '#FFAA27', '#FF6625', '#FF0023',
    '#CC001A', '#730009'
  ]
};

// Create a panel to hold the legend widget
var legend = ui.Panel({style: {position: 'bottom-left', padding: '8px 15px'}});

// Function to generate the legend
function addCategoricalLegend(panel, dict, title) {
  // Create and add the legend title.
  var legendTitle = ui.Label({
    value: title,
    style: {
      fontWeight: 'bold',
      fontSize: '18px',
      margin: '0 0 4px 0',
      padding: '0'
    }
  });
  panel.add(legendTitle);

  var loading = ui.Label('Loading legend...', {margin: '2px 0 4px 0'});
  panel.add(loading);

  // Creates and styles 1 row of the legend.
  var makeRow = function(color, name) {
    // Create the label that is actually the colored box.
    var colorBox = ui.Label({
      style: {
        backgroundColor: color,
        // Use padding to give the box height and width.
        padding: '8px',
        margin: '0 0 4px 0'
      }
    });

    // Create the label filled with the description text.
    var description = ui.Label({value: name, style: {margin: '0 0 4px 6px'}});

    return ui.Panel({
      widgets: [colorBox, description],
      layout: ui.Panel.Layout.Flow('horizontal')
    });
  };

  // Get the list of palette colors and class names from the image.
  var palette = dict['colors'];
  var names = dict['names'];
  loading.style().set('shown', false);

  for (var i = 0; i < names.length; i++) {
    panel.add(makeRow(palette[i], names[i]));
  }

  Map.add(panel);
}

addCategoricalLegend(legend, dict, 'Population Count(estimate)');

Map.addLayer(
    landscan_global.sort('system:time_start')
        .first()
        .sldStyle(popcount_intervals),
    {}, 'Population Count Estimate 2000');
Map.addLayer(
    landscan_global.sort('system:time_start', false)
        .first()
        .sldStyle(popcount_intervals),
    {}, 'Population Count Estimate 2022');