-
Accessibility to Cities 2015

此全球可达性地图列出了 2015 年(基准年)北纬 85 度至南纬 60 度之间所有区域到达最近人口稠密区域的陆路旅行时间。人口稠密地区是指每平方公里有 1,500 名或更多居民的连续区域,或… 无障碍 jrc 地图 牛津 人口 特温特 -
2019 年医疗保健服务可及性

这份全球可达性地图列出了 2019 年(基准年)北纬 85 度至南纬 60 度之间所有区域到达最近医院或诊所的陆路旅行时间(以分钟为单位)。它还包括“仅步行”的出行时间,即仅使用非机动交通工具的出行时间。主要… 无障碍 jrc 地图 牛津 人口 特温特 -
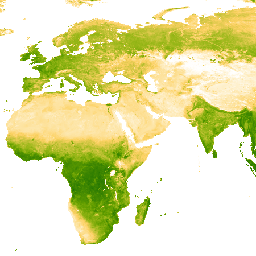
EVI:Malaria Atlas Project 填充了缺失数据的增强型植被指数(每 8 天 1 千米)

此增强型植被指数 (EVI) 产品的基础数据集是 MODIS BRDF 校正后的影像 (MCD43B4),该影像已使用 Weiss 等人 (2014) 概述的方法进行了缺口填充,以消除因云覆盖等因素而导致的数据缺失。在填充缺失数据后,数据被剪裁到 … evi malariaatlasproject map publisher-dataset vegetation vegetation-indices -
EVI:Malaria Atlas Project 填充了缺失数据的增强型植被指数(每年 1 千米)

此增强型植被指数 (EVI) 产品的基础数据集是 MODIS BRDF 校正后的影像 (MCD43B4),该影像已使用 Weiss 等人 (2014) 概述的方法进行了缺口填充,以消除因云覆盖等因素而导致的数据缺失。在填充缺失数据后,数据被剪裁到 … evi malariaatlasproject map publisher-dataset vegetation vegetation-indices -
EVI:Malaria Atlas Project 填充了缺失数据的增强型植被指数(每月 1 千米)

此增强型植被指数 (EVI) 产品的基础数据集是 MODIS BRDF 校正后的影像 (MCD43B4),该影像已使用 Weiss 等人 (2014) 概述的方法进行了缺口填充,以消除因云覆盖等因素而导致的数据缺失。在填充缺失数据后,数据被剪裁到 … evi malariaatlasproject map publisher-dataset vegetation vegetation-indices -
2019 年全球摩擦表面

此全球摩擦表面列出了 2019 年基准年所有陆地像素(位于北纬 85 度和南纬 60 度之间)的陆地旅行速度。它还包括“仅步行”的出行速度,即仅使用非机动交通工具。此地图由…联合制作 无障碍 jrc 地图 牛津 人口 特温特 -
LST Day:Malaria Atlas Project 填充了缺失数据的白天陆地表面温度(每 8 天 1 千米)

白天陆地表面温度 (LST) 是根据约 1 千米的 MODIS MOD11A2 v6.1 产品得出的。将 8 天合成数据转换为摄氏度,然后使用 Weiss 等人 (2014) 概述的方法进行缺口填充,以消除因云覆盖等因素而导致的数据缺失。… 气候 lst malariaatlasproject 地图 publisher-dataset 地表温度 -
LST Day:Malaria Atlas Project 填充了缺失数据的白天陆地表面温度(每年 1 千米)

白天陆地表面温度 (LST) 是根据约 1 千米的 MODIS MOD11A2 v6.1 产品得出的。将 8 天合成数据转换为摄氏度,然后使用 Weiss 等人 (2014) 概述的方法进行缺口填充,以消除因云覆盖等因素而导致的数据缺失。… 气候 lst malariaatlasproject 地图 publisher-dataset 地表温度 -
LST Day:Malaria Atlas Project 填充了缺失数据的白天陆地表面温度(每月 1 千米)

白天陆地表面温度 (LST) 是根据约 1 千米的 MODIS MOD11A2 v6.1 产品得出的。将 8 天合成数据转换为摄氏度,然后使用 Weiss 等人 (2014) 概述的方法进行缺口填充,以消除因云覆盖等因素而导致的数据缺失。… 气候 lst malariaatlasproject 地图 publisher-dataset 地表温度 -
LST Night:Malaria Atlas Project 填充了缺失数据的夜间地表温度(每 8 天 1 千米)

夜间陆地表面温度 (LST) 源自约 1 公里的 MODIS MOD11A2 v6.1 产品。将 8 天合成数据转换为摄氏度,然后使用 Weiss 等人 (2014) 概述的方法进行缺口填充,以消除因云覆盖等因素而导致的数据缺失。… 气候 lst malariaatlasproject 地图 publisher-dataset 地表温度 -
LST Night:Malaria Atlas Project 填充了缺失数据的夜间地表温度(每年 1 千米)

夜间陆地表面温度 (LST) 源自约 1 公里的 MODIS MOD11A2 v6.1 产品。将 8 天合成数据转换为摄氏度,然后使用 Weiss 等人 (2014) 概述的方法进行缺口填充,以消除因云覆盖等因素而导致的数据缺失。… 气候 lst malariaatlasproject 地图 publisher-dataset 地表温度 -
LST Night:Malaria Atlas Project 填充了缺失数据的夜间地表温度(每月 1 千米)

夜间陆地表面温度 (LST) 源自约 1 公里的 MODIS MOD11A2 v6.1 产品。将 8 天合成数据转换为摄氏度,然后使用 Weiss 等人 (2014) 概述的方法进行缺口填充,以消除因云覆盖等因素而导致的数据缺失。… 气候 lst malariaatlasproject 地图 publisher-dataset 地表温度 -
牛津 MAP:疟疾地图集项目分数国际地圈-生物圈计划土地覆盖

此地表覆盖产品的基础数据集是 MODIS 年度地表覆盖产品 (MCD12Q1) 中的 IGBP 层。此数据是从其类别格式(分辨率约为 500 米)转换为分数形式的商品,表示输出的整数百分比 (0-100) … landcover landuse-landcover 地图 牛津 -
TCB:Malaria Atlas Project 填充了缺失数据的 Tasseled Cap 亮度(每 8 天 1 千米)

此填充了缺失数据的 Tasseled Cap 亮度 (TCB) 数据集是将 Lobser 和 Cohen (2007) 中定义的 tasseled-cap 方程应用于 MODIS BRDF 校正后的影像 (MCD43B4) 而创建的。使用 Weiss 等人 (2014) 概述的方法对生成的数据进行了缺口填充,以消除因…而导致的数据缺失。 亮度 malariaatlasproject 地图 publisher-dataset tasseled-cap tcb -
TCB:Malaria Atlas Project 填充了缺失数据的 Tasseled Cap 亮度(每年 1 千米)

此填充了缺失数据的 Tasseled Cap 亮度 (TCB) 数据集是将 Lobser 和 Cohen (2007) 中定义的 tasseled-cap 方程应用于 MODIS BRDF 校正后的影像 (MCD43B4) 而创建的。使用 Weiss 等人 (2014) 概述的方法对生成的数据进行了缺口填充,以消除因…而导致的数据缺失。 亮度 malariaatlasproject 地图 publisher-dataset tasseled-cap tcb -
TCB:Malaria Atlas Project 填充了缺失数据的 Tasseled Cap 亮度(每月 1 千米)

此填充了缺失数据的 Tasseled Cap 亮度 (TCB) 数据集是将 Lobser 和 Cohen (2007) 中定义的 tasseled-cap 方程应用于 MODIS BRDF 校正后的影像 (MCD43B4) 而创建的。使用 Weiss 等人 (2014) 概述的方法对生成的数据进行了缺口填充,以消除因…而导致的数据缺失。 亮度 malariaatlasproject 地图 publisher-dataset tasseled-cap tcb -
TCW:Malaria Atlas Project 填充了缺失数据的 Tasseled Cap 湿度(每 8 天 1 千米)

此填充了缺失数据的 Tasseled Cap 湿度 (TCW) 数据集是将 Lobser 和 Cohen (2007) 中定义的 tasseled-cap 方程应用于 MODIS BRDF 校正后的影像 (MCD43B4) 而创建的。使用 Weiss 等人 (2014) 概述的方法对生成的数据进行了缺口填充,以消除因…而导致的数据缺失。 malariaatlasproject map publisher-dataset tasseled-cap tcw vegetation -
TCW:Malaria Atlas Project 填充了缺失数据的 Tasseled Cap 湿度(每年 1 千米)

此填充了缺失数据的 Tasseled Cap 湿度 (TCW) 数据集是将 Lobser 和 Cohen (2007) 中定义的 tasseled-cap 方程应用于 MODIS BRDF 校正后的影像 (MCD43B4) 而创建的。使用 Weiss 等人 (2014) 概述的方法对生成的数据进行了缺口填充,以消除因…而导致的数据缺失。 malariaatlasproject map publisher-dataset tasseled-cap tcw vegetation -
TCW:Malaria Atlas Project 填充了缺失数据的 Tasseled Cap 湿度(每月 1 千米)

此填充了缺失数据的 Tasseled Cap 湿度 (TCW) 数据集是将 Lobser 和 Cohen (2007) 中定义的 tasseled-cap 方程应用于 MODIS BRDF 校正后的影像 (MCD43B4) 而创建的。使用 Weiss 等人 (2014) 概述的方法对生成的数据进行了缺口填充,以消除因…而导致的数据缺失。 malariaatlasproject map publisher-dataset tasseled-cap tcw vegetation
Datasets tagged map in Earth Engine
[null,null,[],[],["The content describes various datasets from the Oxford Malaria Atlas Project (MAP). These datasets include: Enhanced Vegetation Index (EVI), Fractional Landcover, Daytime and Nighttime Land Surface Temperature (LST), Tasseled Cap Brightness (TCB), and Tasseled Cap Wetness (TCW). Each dataset was created using MODIS imagery and gap-filled to eliminate missing data. Also, accessibility data for travel time to cities (2015) and healthcare (2019), as well as a global friction surface map (2019), are presented.\n"]]
