概要
コレクションでコンテンツを整理
必要に応じて、コンテンツの保存と分類を行います。
データセット用データドリブン スタイル設定を利用すれば、独自の地理空間データセットをアップロードし、データセットに含まれるデータ対象物にカスタム スタイルを適用して地図上に表示することができます。また、ポイント、ポリライン、およびポリゴンのジオメトリをもとにデータ可視化要素を作成し、データ対象物をクリック イベントに反応させることも可能です。データセット用データドリブン スタイル設定は、ベクターマップ専用の機能です(マップ ID が必要となります)。
データセット用データドリブン スタイル設定の利用を始める
カスタム地理空間データセットを追加する
Google Cloud コンソールまたは Google Cloud Shell を使って、カスタムデータを追加します。各データセットには固有の ID があり、この ID を地図のスタイルと関連付けることができます。サポートされるデータ形式は次のとおりです。
データセットの要件と制限事項について詳しくは、データセットを作成・管理するをご覧ください。
公開データセットについて
データセットのスタイル設定を行うには、地図のスタイルをマップ ID に関連付ける必要があります。これにより、データセットとマップ ID が関連付けられます。デベロッパーはアプリ内でこのマップ ID と、それに関連付けられているあらゆる地図のスタイル、および地理空間データを参照できます。地理空間データには追加のアクセス制御が適用されないため、地理空間データをアプリユーザーに効果的に公開できます。
データ対象物をスタイル設定する
カスタムデータをアップロードして地図スタイルとマップ ID に関連付けたら、データ対象物をスタイル設定して、視覚的インパクトを高め、対象物をクリック イベントに反応させることができます。
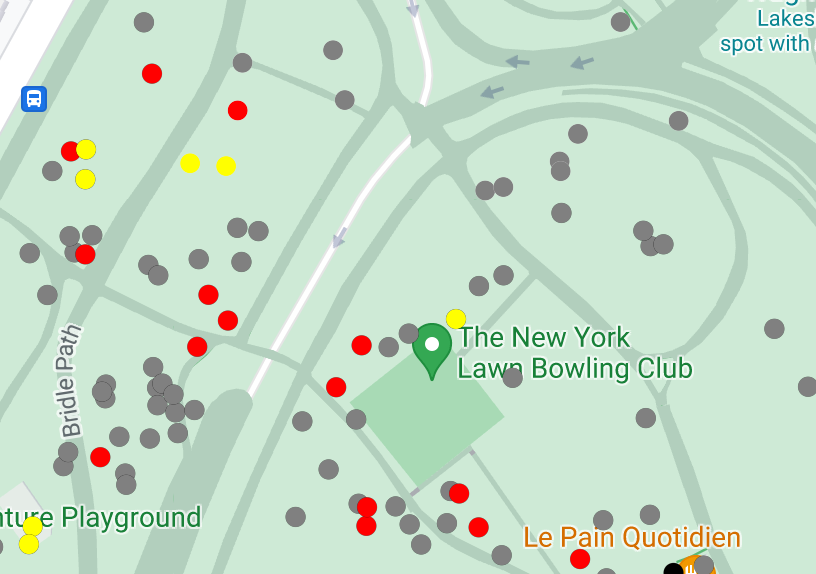
ポイントデータをスタイル設定して個々のスポットを地図上に表示させる
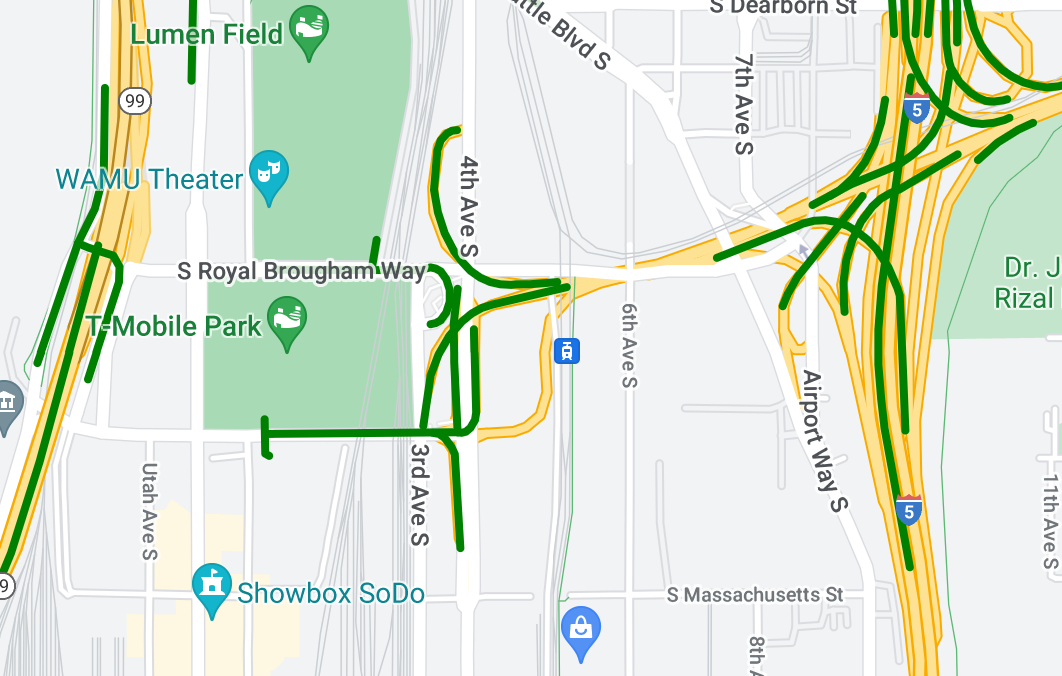
ポリライン データをスタイル設定して地理的な対象物をハイライトする
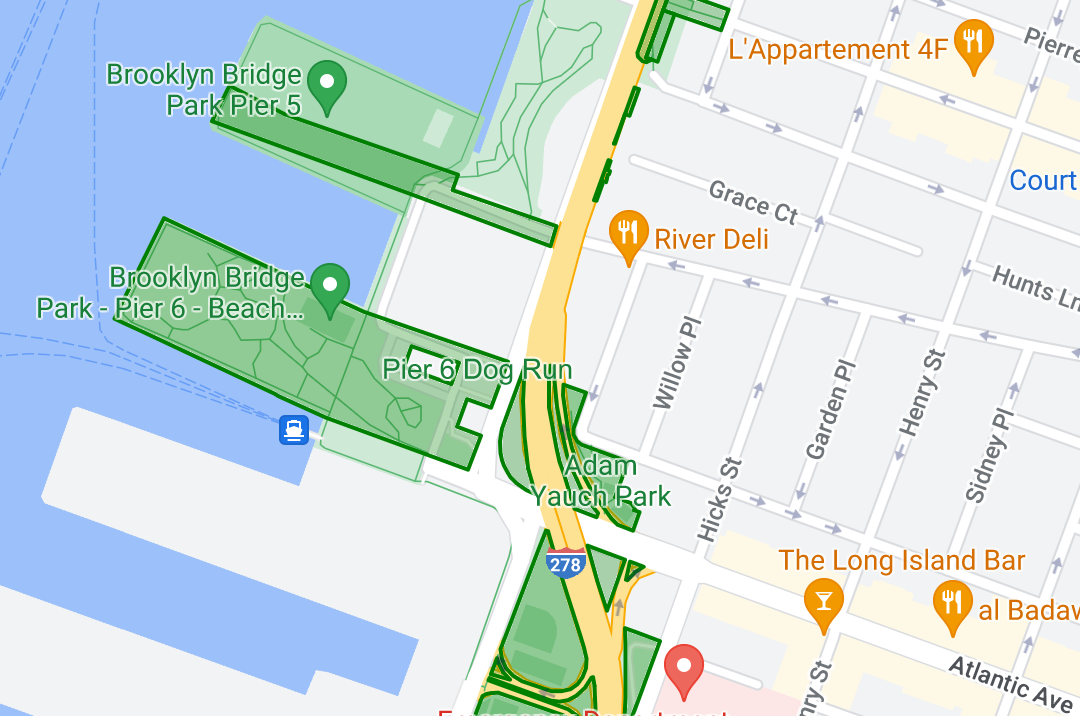
ポリゴンデータをスタイル設定して地理的な領域をハイライトする
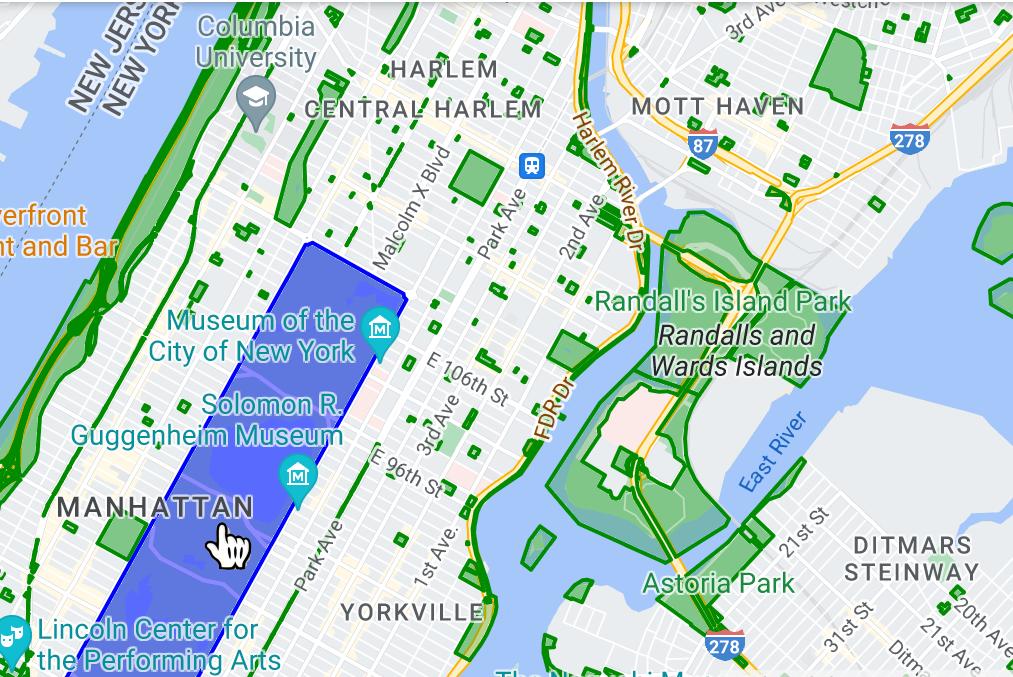
イベント リスナーを追加してデータ対象物をクリック イベントに反応させる
大量のデータ対象物をレンダリングする場合、ズームや回転時にアプリのパフォーマンスが低下したり、不安定になったりするなど、アプリでパフォーマンスの問題が発生する可能性があります。
特に記載のない限り、このページのコンテンツはクリエイティブ・コモンズの表示 4.0 ライセンスにより使用許諾されます。コードサンプルは Apache 2.0 ライセンスにより使用許諾されます。詳しくは、Google Developers サイトのポリシーをご覧ください。Java は Oracle および関連会社の登録商標です。
最終更新日 2024-12-03 UTC。
[null,null,["最終更新日 2024-12-03 UTC。"],[[["\u003cp\u003eData-driven styling allows you to upload, style, and display custom geospatial datasets (GeoJSON, CSV, KML) on vector maps using Google Maps Platform.\u003c/p\u003e\n"],["\u003cp\u003eDatasets are associated with map styles and IDs, enabling data visualization and interactivity based on point, polyline, and polygon geometries.\u003c/p\u003e\n"],["\u003cp\u003ePublic datasets, when linked to a map ID, become accessible to anyone with the app using that ID, requiring awareness regarding data sensitivity.\u003c/p\u003e\n"],["\u003cp\u003eData features can be styled for visual impact and interactivity, such as highlighting locations, geographical features, areas, and responding to click events.\u003c/p\u003e\n"],["\u003cp\u003eRendering a large number of data features might impact app performance, potentially causing lag or stability issues during zoom or rotate operations.\u003c/p\u003e\n"]]],[],null,["Select platform: [Android](/maps/documentation/android-sdk/dds-datasets/overview \"View this page for the Android platform docs.\") [iOS](/maps/documentation/ios-sdk/dds-datasets/overview \"View this page for the iOS platform docs.\") [JavaScript](/maps/documentation/javascript/dds-datasets/overview \"View this page for the JavaScript platform docs.\")\n\n\u003cbr /\u003e\n\nData-driven styling for datasets lets you upload your own geospatial datasets,\napply custom styling to their data features, and display those data features on\nmaps. With data-driven styling for datasets, you can create data visualizations\nbased on point, polyline, and polygon geometries, and make data features respond\nto click events. Data-driven styling for datasets is supported on vector maps\nonly (a map ID is required).\n\n[Get started with data-driven styling for datasets](/maps/documentation/android-sdk/dds-datasets/start)\n\nAdd custom geospatial datasets\n\nAdd your custom data using Google Cloud Console or Google Cloud\nShell. Each dataset has a unique ID, which you can associate with a map style.\nThe following data formats are supported:\n\n- GeoJSON\n- Comma-separated (CSV)\n- KML\n\nFor details about dataset requirements and limitations, see\n[Create and manage a dataset](/maps/documentation/android-sdk/dds-datasets/create-dataset#dataset-prerequisites)\n\nAbout public datasets\n\nIn order to style a dataset you must associate a map style with a map ID, which\nalso associates the dataset to the map ID. In an app, developers can reference\nthat map ID, and any map style and geospatial data associated with it. No\nadditional access control is applied to the geospatial data, making the\ngeospatial data effectively publicly available to anyone with the app.\n\nStyle data features\n\nOnce your custom data has been uploaded and associated to a map\nstyle and map ID, you can style data features for visual impact, and make\nfeatures respond to click events.\n\nStyle point data to show specific locations on the map.\n\nStyle polyline data to highlight geographical features.\n\nStyle polygon data to highlight geographical areas.\n\nMake data features respond to click events by adding an event\nlistener.\n\nPerformance when rendering a large number of data features\n\nWhen rendering a large number of data features, you might notice performance\nissues in your app. For example, you might notice a performance lag or stability\nissues with the app during a zoom or rotate."]]