2D 카드 개요
컬렉션을 사용해 정리하기
내 환경설정을 기준으로 콘텐츠를 저장하고 분류하세요.
지도 타일은 세계를 색인이 지정된 그리드로 나눈 것입니다. 여러 지도 제작 축척에서 지도 데이터에 효율적이고 동적으로 액세스하고 이를 활용할 수 있습니다. Map Tiles API를 사용하면 Google에서 선별한 다음을 비롯한 여러 테마 지리 데이터 세트에 액세스할 수 있습니다.
Google의 지도 제작 스타일이 적용된 벡터 지형 데이터를 기반으로 하는 도로 지도 이미지 타일입니다.
위성과 항공 카메라 모두에서 촬영한 직교 사진으로, 지구의 위에서 아래로 (천정) 이미지를 제공합니다.
음영 등고선 지도
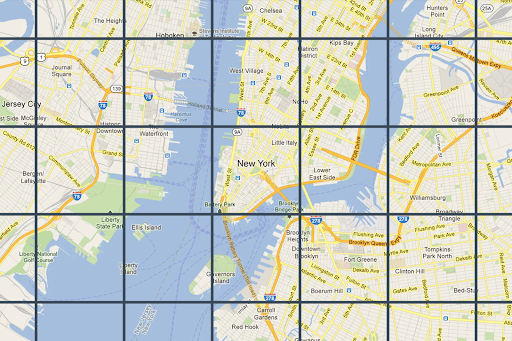
2D 지도 타일은 모두 지리 참조되고 서로 정렬됩니다. 표시 영역의 지리적 범위와 확대/축소 수준에 따라 선택됩니다. 확대/축소 수준은 0 (전 세계를 표시)에서 22 (거리와 블록을 표시)까지입니다.
지도 테마
다음 지도 테마의 지도 타일을 가져올 수 있습니다.
지도 테마
설명
로드맵
도로, 건물, 관심 장소, 정치적 경계
위성 지도
우주에서 촬영한 사진 이미지
지형
초목과 같은 자연 지형지물을 보여주는 등고선 지도
참고: 지도 타일은 하나 이상의 레이어로 구성될 수 있습니다. 예를 들어 위성 지도 테마 위에 도로 지도 레이어를 오버레이할 수 있습니다. 자세한 내용은 선택적 필드 를 참고하세요.
Map Tiles API에서 지도 타일을 요청하려면 먼저 세션 토큰 을 요청해야 합니다. 세션 토큰은 지도와 표시 영역의 현재 상태를 추적합니다. 세션 토큰을 설정할 때 원하는 지도 테마와 일치하도록 mapType
값을 설정해야 합니다.
그런 다음 Map Tiles API에 대한 각 요청에 세션 토큰을 포함해야 합니다.
표시 영역 정보 요청
표시 영역은 세계 장면을 프레임으로 지정하는 상자의 크기를 정의합니다. 표시 영역 정보 요청은 현재 표시 영역을 구성하는 지도 타일에 관한 세부정보를 반환합니다. 뷰포트 정보를 요청하는 이유는 존재하지 않는 확대/축소 수준에서 이미지를 요청하지 않기 위해서입니다.
예를 들어 대부분의 도시에는 확대/축소 수준 22의 이미지가 있지만 바다에는 없습니다. 바다에는 특징이 없는 파란색 정사각형만 표시되기 때문입니다.
참고: 응답에는 지도와 함께 표시해야 하는 저작자 표시와 최대 확대/축소 수준이 포함되어 있으므로 확대/축소 슬라이더를 빌드할 수 있습니다. 자세한 내용은 Map Tiles API 정책 을 참고하세요.
뷰포트 요청은 다음 형식의 HTTPS GET 요청입니다.
curl "https://tile.googleapis.com/tile/v1/viewport ?session=YOUR_SESSION_TOKEN &key=YOUR_API_KEY &zoom=zoom &north=north &south=south &east=east &west=west "
요청에는 다음 필드가 포함됩니다.
zoom
표시 영역의 확대/축소 수준입니다.
north
, south
, east
, west
뷰포트에서 가장 북쪽, 남쪽, 동쪽, 서쪽 지점을 도로 표현합니다. 북쪽과 남쪽은 (-90, 90) 범위에 있어야 하고 동쪽과 서쪽은 (-180, 180) 범위에 있어야 합니다. 본초 자오선을 교차하는 경계를 표현하려면 서쪽은 양수 (예: 170)가 될 수 있고 동쪽은 음수 (예: -170)가 될 수 있습니다. 모든 매개변수는 필수입니다.
표시 영역 정보 응답
표시 영역 응답은 이미지가 있는 영역과 확대/축소 수준을 알려줍니다. 뷰포트 정보 응답의 형식은 다음과 같습니다.
{
"copyright" : "Map data ©2023" ,
"maxZoomRects" : [
{
"maxZoom" : 19 ,
"north" : 90 ,
"south" : -90 ,
"east" : 180 ,
"west" : -180
},
{
"maxZoom" : 9 ,
"north" : 90 ,
"south" : -90 ,
"east" : 180 ,
"west" : -180
},
{
"maxZoom" : 14 ,
"north" : 84.375 ,
"south" : -84.375 ,
"east" : 180 ,
"west" : -180
}, ...
]
}
참고: 이 예시에서 maxZoomRects
배열에는 표시된 것보다 많은 객체가 포함되어 있습니다.
응답 본문에는 다음 필드가 포함됩니다.
copyright
에는 도로 지도 및 위성 타일을 표시할 때 지도에 표시해야 하는 저작자 표시 문자열이 포함됩니다. 자세한 내용은 Map Tiles API 정책 을 참고하세요.
maxZoomRect
현재 뷰포트와 겹치는 경계 사각형의 배열을 포함합니다. 각 직사각형 내에서 사용할 수 있는 최대 확대/축소 수준도 포함합니다.
타일 좌표 함수
대부분의 프로그래밍 언어에서 특정 확대/축소 수준의 위도/경도 쌍을 타일 좌표로 변환하는 도구 (간단한 함수)를 사용할 수 있습니다.
먼저 latLng
에서 점으로 변환한 다음 점에서 타일 좌표로 변환하는 다음 JavaScript 코드 예시를 살펴보세요.
var TILE_SIZE = 256 ;
function fromLatLngToPoint ( latLng ) {
var mercator = - Math . log ( Math . tan (( 0.25 + latLng . lat () / 360 ) * Math . PI ));
return {
x : TILE_SIZE * ( latLng . lng () / 360 + 0.5 ),
y : TILE_SIZE / 2 * ( 1 + mercator / Math . PI )
};
}
function fromLatLngToTileCoord ( latLng , zoom ) {
var point = fromLatLngToPoint ( latLng );
var scale = Math . pow ( 2 , zoom );
return {
x : Math . floor ( point . x * scale / TILE_SIZE ),
y : Math . floor ( point . y * scale / TILE_SIZE ),
z : zoom
};
}
달리 명시되지 않는 한 이 페이지의 콘텐츠에는 Creative Commons Attribution 4.0 라이선스 에 따라 라이선스가 부여되며, 코드 샘플에는 Apache 2.0 라이선스 에 따라 라이선스가 부여됩니다. 자세한 내용은 Google Developers 사이트 정책 을 참조하세요. 자바는 Oracle 및/또는 Oracle 계열사의 등록 상표입니다.
최종 업데이트: 2025-08-29(UTC)
[null,null,["최종 업데이트: 2025-08-29(UTC)"],[[["\u003cp\u003eMap Tiles API allows access to various thematic geodatasets like roadmap, orthophotography, and hillshade, dividing the world into an indexed grid for efficient data utilization.\u003c/p\u003e\n"],["\u003cp\u003eMap tiles are available in roadmap, satellite, and terrain themes, and can be overlaid for richer visualizations.\u003c/p\u003e\n"],["\u003cp\u003eA session token is required for accessing Map Tiles API, which tracks the map state and desired theme.\u003c/p\u003e\n"],["\u003cp\u003eViewport information requests help determine available zoom levels and imagery for a specific area to avoid requesting non-existent data.\u003c/p\u003e\n"],["\u003cp\u003eTile coordinate functions can be used to convert latitude/longitude pairs into tile coordinates for specific zoom levels, enabling precise map tile retrieval.\u003c/p\u003e\n"]]],["Map Tiles API provides access to geodatasets, including roadmap, satellite, and terrain themes, divided into an indexed grid. Users request a session token and specify a map theme. Viewport information, obtained via HTTPS GET requests, determines the available imagery and zoom levels (0-22) within a defined area. Responses include copyright attribution and maximum zoom levels. Tile coordinate functions convert latitude/longitude to tile coordinates for specific zoom levels.\n"],null,["# 2D Tiles overview\n\n**European Economic Area (EEA) developers** If your billing address is in the European Economic Area, effective on 8 July 2025, the [Google\n| Maps Platform EEA Terms of Service](https://cloud.google.com/terms/maps-platform/eea) will apply to your use of the Services. [Learn more](/maps/comms/eea/faq). In addition, certain content from the Map Tiles API will no longer be returned. [Learn more](/maps/comms/eea/map-tiles).\n\nMap Tiles are simply the division of the world into an indexed\ngrid. It lets you access and utilize map data efficiently and dynamically\nat multiple cartographic scales. Map Tiles API gives you access to\nmultiple thematic geodatasets, including Google-curated:\n\n- Roadmap image tiles based on vector topographic data with Google's\n cartographic styling.\n\n- Orthophotography captured by both satellite and airborne cameras that deliver\n top down (nadir) imagery of the earth.\n\n- Hillshade contour maps.\n\n2D Map Tiles are all georeferenced and aligned to each other. They're selected\nbased on the geographic extent of the viewport and the zoom level. Zoom levels\nrange from zero (to view the world in its entirety) to 22 (to view streets and\nblocks).\n\nMap themes\n----------\n\nYou can get map tiles for the following map themes.\n\n| Map theme | Description |\n|-------------------------------------------------|----------------------------------------------------------------|\n| [Roadmap](/maps/documentation/tile/roadmap) | Roads, buildings, points of interest, and political boundaries |\n| [Satellite](/maps/documentation/tile/satellite) | Photographic imagery taken from space |\n| [Terrain](/maps/documentation/tile/terrain) | A contour map that shows natural features such as vegetation |\n\n| **Note:** Map tiles can consist of one or more layers. For example, a roadmap layer can be overlaid on top of a satellite map theme. For more information, see [Optional fields](/maps/documentation/tile/session_tokens#optional_fields).\n\nTo request map tiles from Map Tiles API, you must first request a\n[session token](/maps/documentation/tile/session_tokens). The session token\ntracks the current state of your map and viewport. When you set up your session\ntoken, you must set the `mapType` value to match the map theme that you want.\nThen, you must include the session token in each of your requests to\nMap Tiles API.\n\nViewport information requests\n-----------------------------\n\nThe viewport defines the size of the box that frames the world scene. Viewport\ninformation requests return details about the map tiles that make up your\ncurrent viewport. The reason that you request viewport information is to ensure\nthat you avoid requesting imagery at zoom levels that don't exist.\n\nFor example, most cities have imagery at zoom level 22, but not the ocean since\nit would just end up displaying featureless blue squares.\n| **Note:** Included in the response is the attribution that you must display with your map, and the maximum zoom level---so you can build a zoom slider. For more information, see the [Map Tiles API Policies](/maps/documentation/tile/policies#map-tiles-api).\n\nThe viewport request is an HTTPS GET request in the following form. \n\n```json\ncurl \"https://tile.googleapis.com/tile/v1/viewport?session=\u003cvar class=\"apiparam\" translate=\"no\"\u003eYOUR_SESSION_TOKEN\u003c/var\u003e&key=YOUR_API_KEY&zoom=\u003cvar class=\"apiparam\" translate=\"no\"\u003ezoom\u003c/var\u003e&north=\u003cvar class=\"apiparam\" translate=\"no\"\u003enorth\u003c/var\u003e&south=\u003cvar class=\"apiparam\" translate=\"no\"\u003esouth\u003c/var\u003e&east=\u003cvar class=\"apiparam\" translate=\"no\"\u003eeast\u003c/var\u003e&west=\u003cvar class=\"apiparam\" translate=\"no\"\u003ewest\u003c/var\u003e\"\n```\n\nThe request contains the following fields:\n\n`zoom`\n: The zoom level of the viewport.\n\n`north`, `south`, `east`, `west`\n: The furthest north, south, east, and west points in the viewport, expressed in\n degrees. North and south must be in the range (-90,90), east and west must be in\n the range (-180, 180). To express bounds crossing the antimeridian, west can be\n positive (for example, 170) and east can be negative (for example, -170). All\n parameters are required.\n\nViewport information responses\n------------------------------\n\nThe viewport response tells you which areas have imagery, and at which zoom\nlevels. A viewport information response has the following form. \n\n {\n \"copyright\": \"Map data ©2023\",\n \"maxZoomRects\": [\n {\n \"maxZoom\": 19,\n \"north\": 90,\n \"south\": -90,\n \"east\": 180,\n \"west\": -180\n },\n {\n \"maxZoom\": 9,\n \"north\": 90,\n \"south\": -90,\n \"east\": 180,\n \"west\": -180\n },\n {\n \"maxZoom\": 14,\n \"north\": 84.375,\n \"south\": -84.375,\n \"east\": 180,\n \"west\": -180\n }, ...\n ]\n }\n\n| **Note:** In this example, the `maxZoomRects` array contains more objects than is shown.\n\nThe response body contains the following fields.\n\n`copyright`\n: Contains an attribution string that you must display on your map when you\n display roadmap and satellite tiles. For more information, see the\n [Map Tiles API Policies](/maps/documentation/tile/policies#map-tiles-api).\n\n`maxZoomRect`\n: Contains an array of bounding rectangles that overlap with the current\n viewport. Also contains the maximum zoom level available within each rectangle.\n\nTile coordinate functions\n-------------------------\n\nTools (simple functions) are available in most programming languages to convert\nfrom latitude/longitude pairs to tile coordinates at a specific zoom level.\nConsider the following JavaScript code example that first converts from a\n`latLng` to a point, and then from a point to tile coordinates. \n\n var TILE_SIZE = 256;\n\n function fromLatLngToPoint(latLng) {\n var mercator = -Math.log(Math.tan((0.25 + latLng.lat() / 360) * Math.PI));\n return {\n x: TILE_SIZE * (latLng.lng() / 360 + 0.5),\n y: TILE_SIZE / 2 * (1 + mercator / Math.PI)\n };\n }\n\n function fromLatLngToTileCoord(latLng, zoom) {\n var point = fromLatLngToPoint(latLng);\n var scale = Math.pow(2, zoom);\n\n return {\n x: Math.floor(point.x * scale / TILE_SIZE),\n y: Math.floor(point.y * scale / TILE_SIZE),\n z: zoom\n };\n }"]]