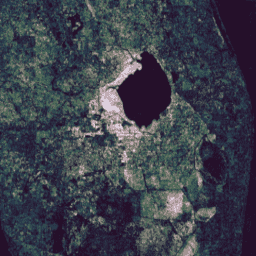
이 컬렉션에는 20년간의 Landsat 표면 반사율 데이터에 연속 변화 감지 및 분류 (CCDC) 알고리즘을 실행하여 사전 계산된 결과가 포함되어 있습니다. CCDC는 동적 RMSE 임계값을 사용한 조화 함수 피팅을 사용하여 시계열 데이터의 중단점을 감지하는 중단점 찾기 알고리즘입니다.
이 데이터 세트는 1999년 1월 1일부터 2019년 12월 31일 사이에 촬영된 모든 주간 이미지를 사용하여 Landsat 5, 7, 8 Collection-1, Tier-1, 표면 반사율 시계열에서 생성되었습니다. 각 이미지는 'pixel_qa' 밴드에 따라 구름, 그림자 또는 눈으로 식별된 픽셀, 포화된 픽셀, 대기 불투명도가 300보다 큰 픽셀('sr_atmos_opacity' 및 'sr_aerosol' 밴드로 식별됨)을 마스크 처리하기 위해 전처리되었습니다. 북쪽/남쪽 장면 오버랩에서 반복되는 픽셀이 중복 제거되었습니다. 결과는 위도 -60°~+85° 사이의 모든 육지에 대해 2도 타일로 출력되었습니다.
이미지는 하나의 전역 이미지로 간단히 mosaic()하기에 적합합니다.
dateFormat를 제외한 기본 알고리즘 매개변수로 CCDC 알고리즘이 실행되었습니다.
tmaskBands: ['green', 'swir']
minObservations: 6
chiSquareProbability: 0.99
minNumOfYearsScaler: 1.33
dateFormat: 1 (분수 연도)
lambda: 20
maxIterations: 25000
출력의 각 픽셀은 가변 길이 배열을 사용하여 인코딩됩니다. 각 배열의 외부 길이 (축 0)는 해당 위치에서 발견된 중단점 수에 해당합니다. coefs 대역에는 2차원 배열이 포함됩니다. 각 내부 배열에는 선형 조화 모델의 8개 항에 대한 스케일링 요소가 [offset, t, cos(ωt), sin(ωt), cos(2ωt), sin(2ωt), cos(3ωt), sin(3ωt)] 순서로 포함됩니다. 여기서 ω = 2Π입니다. 모델은 광학 밴드의 경우 반사율 단위 (0.0~1.0)를 생성하고 열 밴드의 경우 도 (K) / 100.0을 생성하도록 조정됩니다.
출력 밴드는 배열이며 SAMPLE 피라미드 정책을 사용해서만 다운샘플링할 수 있습니다. 확대/축소 수준이 낮으면 결과가 더 이상 전체 해상도 데이터를 나타내지 않으며, 예를 들어 다운샘플링된 마스크로 인해 타일 경계가 표시될 수 있습니다.
따라서 240m/픽셀 미만의 해상도에서는 이 데이터 세트를 사용하지 않는 것이 좋습니다.
2019년 이후 애셋을 이 데이터 세트에 추가할 계획은 현재 없습니다.
대역
픽셀 크기 30미터
대역
이름
픽셀 크기
설명
tStart
미터
각 세그먼트의 시작 날짜 (분수 연도)가 포함된 1차원 배열입니다.
tEnd
미터
각 세그먼트의 종료일을 포함하는 1차원 배열입니다 (분수 연도).
tBreak
미터
감지된 각 세그먼트의 중단점 날짜 (분수 연도)를 포함하는 1차원 배열입니다.
numObs
미터
각 세그먼트에서 발견된 관측치 수를 포함하는 1차원 배열입니다.
changeProb
미터
감지된 중단점이 실제일 의사 확률입니다.
BLUE_coefs
미터
각 세그먼트의 파란색 밴드에 대한 조화 모델 계수를 포함하는 2D 배열입니다.
GREEN_coefs
미터
각 세그먼트의 녹색 밴드에 대한 조화 모델 계수를 포함하는 2D 배열입니다.
RED_coefs
미터
각 세그먼트의 빨간색 밴드에 대한 조화 모델 계수가 포함된 2D 배열입니다.
NIR_coefs
미터
각 세그먼트의 근적외선 대역에 대한 조화 모델 계수를 포함하는 2D 배열입니다.
SWIR1_coefs
미터
각 세그먼트의 단파 적외선 (1.55μm~1.75μm) 대역에 대한 조화 모델 계수를 포함하는 2D 배열입니다.
SWIR2_coefs
미터
각 세그먼트의 단파 적외선 (2.09μm~2.35μm) 대역에 대한 조화 모델 계수를 포함하는 2D 배열입니다.
TEMP_coefs
미터
각 세그먼트의 열 밴드에 대한 조화 모델 계수를 포함하는 2D 배열입니다.
BLUE_rmse
미터
각 세그먼트에 대한 파란색 밴드의 모델 RMSE가 포함된 1차원 배열입니다.
GREEN_rmse
미터
각 세그먼트에 대해 녹색 대역의 모델 RMSE를 포함하는 1차원 배열입니다.
RED_rmse
미터
각 세그먼트의 빨간색 밴드에 대한 모델의 RMSE가 포함된 1차원 배열입니다.
NIR_rmse
미터
각 세그먼트에 대한 근적외선 대역의 모델 RMSE를 포함하는 1차원 배열입니다.
SWIR1_rmse
미터
각 세그먼트의 단파 적외선 (1.55μm~1.75μm) 대역에 대한 모델의 RMSE가 포함된 1차원 배열입니다.
SWIR2_rmse
미터
각 세그먼트의 단파 적외선 (2.09μm~2.35μm) 대역에 대한 모델의 RMSE를 포함하는 1차원 배열입니다.
TEMP_rmse
미터
각 세그먼트에 대한 열 밴드의 모델 RMSE를 포함하는 1차원 배열입니다.
BLUE_magnitude
미터
각 세그먼트의 파란색 밴드에 대해 감지된 중단점의 크기를 포함하는 1차원 배열입니다.
GREEN_magnitude
미터
각 세그먼트에 대해 감지된 녹색 대역의 중단점 크기를 포함하는 1차원 배열입니다.
RED_magnitude
미터
각 세그먼트에 대해 감지된 빨간색 대역의 절단점 크기를 포함하는 1차원 배열입니다.
NIR_magnitude
미터
각 세그먼트에 대해 감지된 근적외선 대역의 절단점 크기를 포함하는 1차원 배열입니다.
SWIR1_magnitude
미터
각 세그먼트에 대해 감지된 단파 적외선-1 (1.55μm~1.75μm) 대역의 크기를 포함하는 1차원 배열입니다.
SWIR2_magnitude
미터
각 세그먼트에 대해 감지된 단파 적외선-2 (2.09μm~2.35μm) 대역의 크기를 포함하는 1차원 배열입니다.
이 컬렉션에는 20년간의 Landsat 지표 반사율 데이터에 연속 변경 감지 및 분류 (CCDC) 알고리즘을 실행하여 사전 계산된 결과가 포함되어 있습니다. CCDC는 동적 RMSE 임계값을 사용한 조화 피팅을 사용하여 시계열 데이터의 중단점을 감지하는 중단점 찾기 알고리즘입니다. 데이터 세트가 …에서 생성되었습니다.
[null,null,[],[[["\u003cp\u003eThe Google Global Landsat-based CCDC Segments dataset provides precomputed results of the Continuous Change Detection and Classification (CCDC) algorithm applied to 20 years of Landsat data (1999-2019).\u003c/p\u003e\n"],["\u003cp\u003eCCDC detects breakpoints in time-series data using harmonic fitting with a dynamic RMSE threshold, identifying changes in land cover and land use.\u003c/p\u003e\n"],["\u003cp\u003eThe dataset covers landmasses between -60° and +85° latitude at a 30-meter resolution, derived from Landsat 5, 7, and 8 Collection-1, Tier-1 surface reflectance data.\u003c/p\u003e\n"],["\u003cp\u003eEach pixel contains information about detected breakpoints, including start and end dates, magnitude of change, and harmonic model coefficients for various spectral bands.\u003c/p\u003e\n"],["\u003cp\u003eThe dataset is available in Earth Engine and is intended for research, education, and non-profit use under a CC-BY-4.0 license.\u003c/p\u003e\n"]]],["The dataset, available from 1999-01-01 to 2020-01-01 via Google Earth Engine, provides precomputed results from the Continuous Change Detection and Classification (CCDC) algorithm applied to 20 years of Landsat data. Using harmonic fitting, CCDC identifies breakpoints in time-series data across landmasses between -60° and +85° latitude. The output, at 30-meter resolution, includes start, end, and breakpoint dates, observation counts, change probabilities, model coefficients, RMSE, and breakpoint magnitudes for various spectral bands.\n"],null,["# Google Global Landsat-based CCDC Segments (1999-2019)\n\nDataset Availability\n: 1999-01-01T00:00:00Z--2020-01-01T00:00:00Z\n\nDataset Provider\n:\n\n\n [Google](https://earthengine.google.com/)\n\nTags\n:\n[change-detection](/earth-engine/datasets/tags/change-detection) [google](/earth-engine/datasets/tags/google) [landcover](/earth-engine/datasets/tags/landcover) [landsat-derived](/earth-engine/datasets/tags/landsat-derived) [landuse](/earth-engine/datasets/tags/landuse) [landuse-landcover](/earth-engine/datasets/tags/landuse-landcover) \n\n#### Description\n\nThis collection contains precomputed results from running the\nContinuous Change Detection and Classification (CCDC) algorithm on\n20 years of Landsat surface reflectance data. CCDC is a break-point\nfinding algorithm that uses harmonic fitting with a dynamic RMSE\nthreshold to detect breakpoints in time-series data.\n\nThe dataset was created from the Landsat 5, 7, and 8 Collection-1, Tier-1,\nsurface reflectance time series, using all daytime images between 1999-01-01\nand 2019-12-31. Each image was preprocessed to mask pixels identified as\ncloud, shadow, or snow (according to the 'pixel_qa' band), saturated pixels,\nand pixels with an atmospheric opacity \\\u003e 300 (as identified by the\n'sr_atmos_opacity' and 'sr_aerosol' bands). Pixels repeated in\nnorth/south scene overlap were deduplicated. The results were\noutput in 2-degree tiles for all landmasses between -60° and +85° latitude.\nThe images are suitable to simply mosaic() into one global image.\n\nThe CCDC algorithm was run with the default algorithm parameters except for\nthe dateFormat:\n\n- tmaskBands: \\['green', 'swir'\\]\n- minObservations: 6\n- chiSquareProbability: 0.99\n- minNumOfYearsScaler: 1.33\n- dateFormat: 1 (fractional year)\n- lambda: 20\n- maxIterations: 25000\n\nEach pixel in the output is encoded using variable length arrays. The outer\nlength of each array (axis 0) corresponds to the number of breakpoints\nfound at that location. The coefs bands contain 2-D arrays, where each inner\narray contains the scaling factors for the 8 terms in the linear harmonic\nmodel, in the order: \\[offset, t, cos(ωt), sin(ωt), cos(2ωt),\nsin(2ωt), cos(3ωt), sin(3ωt)\\], where ω = 2Π. The\nmodels are scale to produce refelectance units (0.0 - 1.0) for the optical\nbands and degrees (K) / 100.0 for the thermal band.\n\nNote that since the output bands are arrays and can only be downsampled\nusing a SAMPLE pyramiding policy. At lower zoom levels, the\nresults are usually no longer representative of the full-resolution data,\nand, for instance, tile boundaries can be seen due to the downsampled masks.\nIt's therefore not recommended to use this dataset at resolutions less than\n240m/pixel.\n\nThere are no current plans to add post-2019 assets to this dataset.\n\n### Bands\n\n\n**Pixel Size**\n\n30 meters\n\n**Bands**\n\n| Name | Pixel Size | Description |\n|-------------------|------------|------------------------------------------------------------------------------------------------------------------------------------|\n| `tStart` | meters | 1-D Array containing the date of the start of each segment (fractional year). |\n| `tEnd` | meters | 1-D Array containing the date of the end of each segment (fractional year). |\n| `tBreak` | meters | 1-D Array containing the date of the detected breakpoint of each segment (fractional year). |\n| `numObs` | meters | 1-D Array containing the number of observations found in each segment. |\n| `changeProb` | meters | A pseudo-probability of the detected breakpoint being real. |\n| `BLUE_coefs` | meters | 2-D array containing harmonic model coefficients for the blue band, for each segment. |\n| `GREEN_coefs` | meters | 2-D array containing harmonic model coefficients for the green band, for each segment. |\n| `RED_coefs` | meters | 2-D array containing harmonic model coefficients for the red band, for each segment. |\n| `NIR_coefs` | meters | 2-D array containing harmonic model coefficients for the near-infrared band, for each segment. |\n| `SWIR1_coefs` | meters | 2-D array containing harmonic model coefficients for the shortwave-infrared (1.55μm-1.75μm) band, for each segment. |\n| `SWIR2_coefs` | meters | 2-D array containing harmonic model coefficients for the shortwave-infrared (2.09μm-2.35μm) band, for each segment. |\n| `TEMP_coefs` | meters | 2-D array containing harmonic model coefficients for the thermal band, for each segment. |\n| `BLUE_rmse` | meters | 1-D array containing the RMSE of the model for the blue band, for each segment. |\n| `GREEN_rmse` | meters | 1-D array containing the RMSE of the model for the green band, for each segment. |\n| `RED_rmse` | meters | 1-D array containing the RMSE of the model for the red band, for each segment. |\n| `NIR_rmse` | meters | 1-D array containing the RMSE of the model for the near-infrared band, for each segment. |\n| `SWIR1_rmse` | meters | 1-D array containing the RMSE of the model for the the shortwave-infrared (1.55μm-1.75μm) band, for each segment. |\n| `SWIR2_rmse` | meters | 1-D array containing the RMSE of the model for the shortwave-infrared (2.09μm-2.35μm) band, for each segment. |\n| `TEMP_rmse` | meters | 1-D array containing the RMSE of the model for the thermal band, for each segment. |\n| `BLUE_magnitude` | meters | 1-D array containing the magnitude of the detected breakpoint for the blue band, for each segment. |\n| `GREEN_magnitude` | meters | 1-D array containing the magnitude of the detected breakpoint for the green band, for each segment. |\n| `RED_magnitude` | meters | 1-D array containing the magnitude of the detected breakpoint for the red band, for each segment. |\n| `NIR_magnitude` | meters | 1-D array containing the magnitude of the detected breakpoint for the near-infrared band, for each segment. |\n| `SWIR1_magnitude` | meters | 1-D array containing the magnitude of the detected breakpoint for the shortwave-infrared-1 (1.55μm-1.75μm) band, for each segment. |\n| `SWIR2_magnitude` | meters | 1-D array containing the magnitude of the detected breakpoint for the shortwave-infrared-2 (2.09μm-2.35μm) band, for each segment. |\n| `TEMP_magnitude` | meters | 1-D array containing the magnitude of the detected breakpoint for the thermal band, for each segment. |\n\n### Terms of Use\n\n**Terms of Use**\n\n[CC-BY-4.0](https://spdx.org/licenses/CC-BY-4.0.html)\n**Important:** Earth Engine is a platform for petabyte-scale scientific analysis and visualization of geospatial datasets, both for public benefit and for business and government users. Earth Engine is free to use for research, education, and nonprofit use. To get started, please [register for Earth Engine access.](https://console.cloud.google.com/earth-engine) \n[Google Global Landsat-based CCDC Segments (1999-2019)](/earth-engine/datasets/catalog/GOOGLE_GLOBAL_CCDC_V1) \nThis collection contains precomputed results from running the Continuous Change Detection and Classification (CCDC) algorithm on 20 years of Landsat surface reflectance data. CCDC is a break-point finding algorithm that uses harmonic fitting with a dynamic RMSE threshold to detect breakpoints in time-series data. The dataset was created from the ... \nGOOGLE/GLOBAL_CCDC/V1, change-detection,google,landcover,landsat-derived,landuse,landuse-landcover \n1999-01-01T00:00:00Z/2020-01-01T00:00:00Z \n-60 -180 72 180 \nGoogle Earth Engine \nhttps://developers.google.com/earth-engine/datasets\n\n- [](https://doi.org/https://earthengine.google.com/)\n- [](https://doi.org/https://developers.google.com/earth-engine/datasets/catalog/GOOGLE_GLOBAL_CCDC_V1)"]]