- Disponibilité de l'ensemble de données
- 2024-03-16T00:00:00Z–2024-03-16T23:59:59Z
- Fournisseur de l'ensemble de données
- Joint Research Centre
- Tags
Description
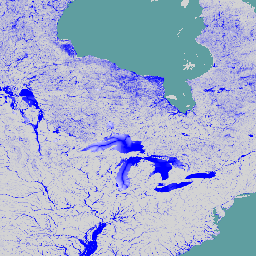
Les cartes mondiales des risques d'inondation fluviale sont un ensemble de données maillées représentant l'inondation le long du réseau fluvial, pour sept périodes de retour d'inondation différentes (de 1 an sur 10 à 1 an sur 500). Les données d'entrée sur le débit des cours d'eau pour les nouvelles cartes sont produites à l'aide du modèle hydrologique open source LISFLOOD, tandis que les simulations d'inondation sont effectuées avec le modèle hydrodynamique LISFLOOD-FP. L'étendue comprend le monde entier, à l'exception du Groenland et de l'Antarctique, ainsi que des petites îles dont les bassins fluviaux sont inférieurs à 500 km².
Les valeurs des cellules indiquent la profondeur de l'eau (en mètres). Les cartes peuvent être utilisées pour évaluer l'exposition de la population et des actifs économiques aux inondations fluviales, et pour effectuer des évaluations des risques d'inondation. L'ensemble de données est créé dans le cadre du service Copernicus Emergency Management.
Cette version inclut également des ensembles de données supplémentaires. Pour chaque tuile, une carte des risques d'inondation est disponible, avec la profondeur de l'eau classée selon la couche statique GloFAS "Période de retour de 100 ans pour les risques d'inondation". De plus, la bande "spurious_depth_category" identifie les zones où des profondeurs supérieures à 10 mètres sont prévues dans les petits canaux (moins de 3 000 km²) pour la période de retour de 10 ans, y compris une zone tampon de 2 km.
Bracelets
Taille des pixels
90 mètres
Bandes de fréquences
| Nom | Unités | Min | Max | Taille des pixels | Description |
|---|---|---|---|---|---|
RP10_depth |
m | 0,1 | 160 | mètres | Profondeur d'inondation pour une période de retour de 10 ans |
RP20_depth |
m | 0,1 | 199 | mètres | Profondeur d'inondation pour une période de retour de 20 ans |
RP50_depth |
m | 0,1 | 258.1 | mètres | Profondeur d'inondation pour une période de retour de 50 ans |
RP75_depth |
m | 0,1 | 283.6 | mètres | Profondeur d'inondation pour une période de retour de 75 ans |
RP100_depth |
m | 0,1 | 301.6 | mètres | Profondeur d'inondation pour une période de retour de 100 ans |
RP200_depth |
m | 0,1 | 344,8 | mètres | Profondeur d'inondation pour une période de retour de 200 ans |
RP500_depth |
m | 0,1 | 401.3 | mètres | Profondeur d'inondation pour une période de retour de 500 ans |
RP10_depth_category |
2 | 4 | mètres | Profondeur de l'eau classée comme la couche statique de période de retour de 100 ans du risque d'inondation GloFAS pour une période de retour de 10 ans |
|
RP20_depth_category |
2 | 4 | mètres | Profondeur de l'eau classée comme couche statique de période de retour de 100 ans pour le risque d'inondation GloFAS pour une période de retour de 20 ans |
|
RP50_depth_category |
2 | 4 | mètres | Profondeur de l'eau classée comme couche statique de période de retour de 100 ans pour le risque d'inondation GloFAS, pour une période de retour de 50 ans |
|
RP75_depth_category |
2 | 4 | mètres | Profondeur de l'eau classée comme la couche statique de période de retour de 100 ans du risque d'inondation GloFAS pour une période de retour de 75 ans |
|
RP100_depth_category |
2 | 4 | mètres | Profondeur de l'eau classée comme la couche statique de période de retour de 100 ans du risque d'inondation GloFAS |
|
RP200_depth_category |
2 | 4 | mètres | Profondeur de l'eau classée comme couche statique de période de retour de 100 ans pour le risque d'inondation GloFAS, pour une période de retour de 200 ans |
|
RP500_depth_category |
2 | 4 | mètres | Profondeur de l'eau classée comme couche statique de période de retour de 500 ans pour le risque d'inondation GloFAS avec une période de retour de 100 ans |
|
permanent_water_class |
1 | 1 | mètres | Plans d'eau permanents utilisés pour corriger les cartes des zones inondables |
|
spurious_depth_category |
1 | 1 | mètres | Identifie les zones où des profondeurs > 10 m sont prévues dans les petits canaux (< 3 000 km²) pour la période de retour de 10 ans, plus une marge de 2 km. |
Propriétés des images
Propriétés des images
| Nom | Type | Description |
|---|---|---|
| id | INT | Identifiant unique de la cellule de grille de latitude/longitude. |
Conditions d'utilisation
Conditions d'utilisation
Les ensembles de données du JRC sont disponibles sans restriction d'utilisation ni de distribution. Pour en savoir plus, consultez Droits d'accès.
Citations
Baugh, Calum; Colonese, Juan; D'Angelo, Claudia; Dottori, Francesco; Neal, Jeffrey; Prudhomme, Christel; Salamon, Peter (2024): Global river flood hazard maps. Commission européenne, Centre commun de recherche (CCR) [Ensemble de données] PID : http://data.europa.eu/89h/jrc-floods-floodmapgl_rp50y-tif
DOI
Explorer avec Earth Engine
Éditeur de code (JavaScript)
var dataset = ee.ImageCollection('JRC/CEMS_GLOFAS/FloodHazard/v2_1');
var depth = dataset.select('RP100_depth');
var depthVis = {
  min: 0,
  max: 1,
  palette: ['ffffff','0000ff'],
};
Map.setCenter(-86.47, 47.28, 4);
Map.addLayer(depth, depthVis, 'JRC Flood Hazard Maps V2.1');