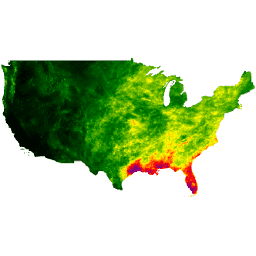
PRISM 일일 및 월별 데이터 세트는 오리건 주립대학교의 PRISM Climate Group에서 생성한 미국 본토의 그리드형 기후 데이터 세트입니다.
그리드는 PRISM (Parameter-elevation Regressions on Independent Slopes Model)을 사용하여 개발됩니다. PRISM 보간 루틴은 고도에 따라 날씨와 기후가 어떻게 달라지는지 시뮬레이션하고, 해안 효과, 온도 역전, 강수량을 감소시킬 수 있는 지형 장벽을 고려합니다. 관측소 데이터는 전국 여러 네트워크에서 동화됩니다. 자세한 내용은 PRISM 공간 기후 데이터 세트 설명을 참고하세요.
대역
픽셀 크기 928미터
대역
이름
단위
최소
최대
픽셀 크기
설명
ppt
mm
0.03*
1046.09*
미터
30년간의 월별 총 강수량 (비와 녹은 눈 포함) 평균
tmean
°C
-16.15*
37.88*
미터
월별 평균 기온의 30년 평균(tmin+tmax)/2로 계산)
tmin
°C
-21.9*
29.79*
미터
30년 월별 최저 온도 평균
tmax
°C
-10.78*
46.63*
미터
30년간 월별 최고 기온의 평균
tdmean
°C
-19.07*
25.22*
미터
월별 평균 이슬점 온도의 30년 평균
vpdmin
hPa
0*
33.11*
미터
월별 최소 증기압 부족의 30년 평균
vpdmax
hPa
0.37*
94.11*
미터
30년 동안의 월별 최대 증기압 부족 평균
solclear
MJ m^-2 day^-1
미터
맑은 하늘 조건에서 수평면에 수신된 월별 전 세계 단파 태양 복사열의 30년 평균
solslope
MJ m^-2 day^-1
미터
경사진 표면에 수신된 월별 전 세계 단파 태양 복사열의 30년 평균
soltotal
MJ m^-2 day^-1
미터
수평면에 수신된 월별 전역 단파 태양 복사열의 30년 평균
soltrans
분수
미터
30년간의 대기 투과율 (구름) 평균
* 예상 최솟값 또는 최댓값
이미지 속성
이미지 속성
이름
유형
설명
PRISM_DATASET_CREATE_DATE
STRING_LIST
각 밴드의 원래 생성 날짜 목록입니다. 예를 들어 첫 번째 요소는 첫 번째 밴드 'ppt'에 해당하고 두 번째 요소는 두 번째 밴드 'tmean'에 해당합니다.
PRISM_DATASET_TYPE
STRING_LIST
밴드별 데이터 세트 유형 목록
PRISM_CODE_VERSION
STRING_LIST
대역별 코드 버전 목록
PRISM_DATASET_FILENAME
STRING_LIST
밴드별 원본 파일 이름 목록
이용약관
이용약관
이러한 PRISM 데이터 세트는 사용 또는 배포에 제한 없이 사용할 수 있습니다. PRISM Climate Group에서는 사용자가 적절한 출처 표시를 제공하고 해당되는 경우 PRISM을 데이터 소스로 식별하도록 요청합니다.
https://prism.oregonstate.edu/terms/
인용
인용:
Daly, C., Halbleib, M., Smith, J.I., Gibson, W.P., Doggett, M.K.,
Taylor, G.H., Curtis, J., and Pasteris, P.A. 2008. 미국 본토 전역의 온도와 강수량을 지형학적으로 민감하게 매핑합니다. International Journal of Climatology, 28: 2031-2064
doi:10.1002/joc.1688pdf.
PRISM 일일 및 월별 데이터 세트는 오리건 주립대학교의 PRISM Climate Group에서 생성한 미국 본토의 격자형 기후 데이터 세트입니다. 그리드는 PRISM (Parameter-elevation Regressions on Independent Slopes Model)을 사용하여 개발됩니다. PRISM 보간 루틴은 고도에 따라 날씨와 기후가 어떻게 달라지는지 시뮬레이션하고 …
[null,null,[],[[["\u003cp\u003eThe PRISM Norm91m dataset provides 30-year average monthly climate data for the conterminous United States, including precipitation, temperature, and solar radiation.\u003c/p\u003e\n"],["\u003cp\u003eDeveloped by the PRISM Climate Group at Oregon State University, it utilizes the PRISM interpolation method which accounts for terrain and coastal effects for higher accuracy.\u003c/p\u003e\n"],["\u003cp\u003eThe dataset has a spatial resolution of 928 meters and covers the period from 1991 to 2020.\u003c/p\u003e\n"],["\u003cp\u003eIt is freely available for use with proper attribution to PRISM.\u003c/p\u003e\n"],["\u003cp\u003eYou can access and analyze this dataset using Google Earth Engine.\u003c/p\u003e\n"]]],["The PRISM Climate Group at Oregon State University provides gridded climate datasets for the contiguous U.S. from 1991 to 2020, available via the Earth Engine platform. These datasets, generated using the PRISM model, include 30-year averages of monthly precipitation, temperature (mean, min, max), dew point, vapor pressure deficit, and solar radiation metrics at 928-meter pixel resolution. Data can be accessed with code snippet provided, and used with proper attribution.\n"],null,["# PRISM Long-Term Average Climate Dataset Norm91m\n\nDataset Availability\n: 1991-01-01T00:00:00Z--2020-12-31T00:00:00Z\n\nDataset Provider\n:\n\n\n [PRISM / OREGONSTATE](https://www.prism.oregonstate.edu/)\n\nClimatological Interval\n: 1 Month\n\nTags\n:\n [climate](/earth-engine/datasets/tags/climate) [geophysical](/earth-engine/datasets/tags/geophysical) [oregonstate](/earth-engine/datasets/tags/oregonstate) [precipitation](/earth-engine/datasets/tags/precipitation) [pressure](/earth-engine/datasets/tags/pressure) [prism](/earth-engine/datasets/tags/prism) [temperature](/earth-engine/datasets/tags/temperature) [vapor](/earth-engine/datasets/tags/vapor) [weather](/earth-engine/datasets/tags/weather) \n30-year \n\n#### Description\n\nThe PRISM daily and monthly datasets are gridded climate\ndatasets for the conterminous United States, produced by the\nPRISM Climate Group at Oregon State University.\n\nGrids are\ndeveloped using PRISM (Parameter-elevation Regressions on Independent\nSlopes Model). PRISM interpolation routines simulate how weather\nand climate vary with elevation, and account for coastal effects,\ntemperature inversions, and terrain barriers that can cause rain\nshadows. Station data are assimilated from many networks across\nthe country. For more information, see the [Descriptions of PRISM\nSpatial Climate Datasets](https://www.prism.oregonstate.edu/documents/PRISM_datasets.pdf).\n\n### Bands\n\n\n**Pixel Size**\n\n928 meters\n\n**Bands**\n\n| Name | Units | Min | Max | Pixel Size | Description |\n|------------|------------------|----------|-----------|------------|-------------------------------------------------------------------------------------------------------------------------|\n| `ppt` | mm | 0.03\\* | 1046.09\\* | meters | 30-year average of monthly total precipitation (including rain and melted snow) |\n| `tmean` | °C | -16.15\\* | 37.88\\* | meters | 30-year average of monthly mean temperature (calculated as (tmin+tmax)/2) |\n| `tmin` | °C | -21.9\\* | 29.79\\* | meters | 30-year average of monthly minimum temperature |\n| `tmax` | °C | -10.78\\* | 46.63\\* | meters | 30-year average of monthly maximum temperature |\n| `tdmean` | °C | -19.07\\* | 25.22\\* | meters | 30-year average of monthly mean dew point temperature |\n| `vpdmin` | hPa | 0\\* | 33.11\\* | meters | 30-year average of monthly minimum vapor pressure deficit |\n| `vpdmax` | hPa | 0.37\\* | 94.11\\* | meters | 30-year average of monthly maximum vapor pressure deficit |\n| `solclear` | MJ m\\^-2 day\\^-1 | | | meters | 30-year average of monthly global shortwave solar radiation received on a horizontal surface under clear sky conditions |\n| `solslope` | MJ m\\^-2 day\\^-1 | | | meters | 30-year average of monthly global shortwave solar radiation received on a sloped surface |\n| `soltotal` | MJ m\\^-2 day\\^-1 | | | meters | 30-year average of monthly global shortwave solar radiation received on a horizontal surface |\n| `soltrans` | Fraction | | | meters | 30-year average of atmospheric transmittance (cloudiness) |\n\n\\* estimated min or max value\n\n### Image Properties\n\n**Image Properties**\n\n| Name | Type | Description |\n|---------------------------|-------------|------------------------------------------------------------------------------------------------------------------------------------------------------|\n| PRISM_DATASET_CREATE_DATE | STRING_LIST | List of original creation dates for each band, e.g: the first element is for the first band \"ppt\", the second element is for the second band \"tmean\" |\n| PRISM_DATASET_TYPE | STRING_LIST | List of dataset types per-band |\n| PRISM_CODE_VERSION | STRING_LIST | List of code versions per-band |\n| PRISM_DATASET_FILENAME | STRING_LIST | List of original filenames per-band |\n\n### Terms of Use\n\n**Terms of Use**\n\nThese PRISM datasets are available without restriction\non use or distribution. PRISM Climate Group does request that the\nuser give proper attribution and identify PRISM, where applicable,\nas the source of the data.\n\u003chttps://prism.oregonstate.edu/terms/\u003e\n\n### Citations\n\nCitations:\n\n- Daly, C., Halbleib, M., Smith, J.I., Gibson, W.P., Doggett, M.K.,\n Taylor, G.H., Curtis, J., and Pasteris, P.A. 2008. Physiographically-sensitive\n mapping of temperature and precipitation across the conterminous\n United States. International Journal of Climatology, 28: 2031-2064\n [doi:10.1002/joc.1688](https://doi.org/10.1002/joc.1688)\n [pdf](https://www.prism.oregonstate.edu/documents/pubs/2008intjclim_physiographicMapping_daly.pdf).\n- \\[Daly, C., J.I. Smith, and K.V. Olson. 2015. Mapping atmospheric\n moisture climatologies across the conterminous United States. PloS\n ONE 10(10):e0141140.\n [doi:10.1371/journal.pone.0141140](https://doi.org/10.1371/journal.pone.0141140).\n\n### DOIs\n\n- \u003chttps://doi.org/10.1371/journal.pone.0141140\u003e\n\n### Explore with Earth Engine\n\n| **Important:** Earth Engine is a platform for petabyte-scale scientific analysis and visualization of geospatial datasets, both for public benefit and for business and government users. Earth Engine is free to use for research, education, and nonprofit use. To get started, please [register for Earth Engine access.](https://console.cloud.google.com/earth-engine)\n\n### Code Editor (JavaScript)\n\n```javascript\nvar dataset = ee.ImageCollection('OREGONSTATE/PRISM/Norm91m');\nvar precipitation = dataset.select('ppt');\nvar precipitationVis = {\n min: 0.0,\n max: 300.0,\n palette: ['red', 'yellow', 'green', 'cyan', 'purple'],\n};\nMap.setCenter(-100.55, 40.71, 0);\nMap.addLayer(precipitation, precipitationVis, 'Precipitation');\n```\n[Open in Code Editor](https://code.earthengine.google.com/?scriptPath=Examples:Datasets/OREGONSTATE/OREGONSTATE_PRISM_Norm91m) \n[PRISM Long-Term Average Climate Dataset Norm91m](/earth-engine/datasets/catalog/OREGONSTATE_PRISM_Norm91m) \nThe PRISM daily and monthly datasets are gridded climate datasets for the conterminous United States, produced by the PRISM Climate Group at Oregon State University. Grids are developed using PRISM (Parameter-elevation Regressions on Independent Slopes Model). PRISM interpolation routines simulate how weather and climate vary with elevation, and account for ... \nOREGONSTATE/PRISM/Norm91m, climate,geophysical,oregonstate,precipitation,pressure,prism,temperature,vapor,weather \n1991-01-01T00:00:00Z/2020-12-31T00:00:00Z \n24 -125 50 -66 \nGoogle Earth Engine \nhttps://developers.google.com/earth-engine/datasets\n\n- [https://doi.org/10.1371/journal.pone.0141140](https://doi.org/https://www.prism.oregonstate.edu/)\n- [https://doi.org/10.1371/journal.pone.0141140](https://doi.org/https://developers.google.com/earth-engine/datasets/catalog/OREGONSTATE_PRISM_Norm91m)"]]