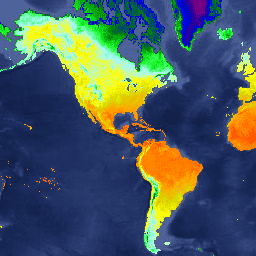
L'ensemble de données sous-jacent de ce produit nocturne est constitué de données MODIS sur la température de la surface terrestre (MOD11A2), qui ont été complétées à l'aide de l'approche décrite dans Weiss et al. (2014) pour éliminer les données manquantes causées par des facteurs tels que la couverture nuageuse. Les sorties sans lacunes ont ensuite été agrégées de manière temporelle et spatiale pour produire le produit mensuel d'environ 5 km.
Cet ensemble de données a été produit par Harry Gibson et Daniel Weiss du Malaria Atlas Project (Big Data Institute, Université d'Oxford, Royaume-Uni, https://malariaatlas.org/).
Bracelets
Taille des pixels 5 000 mètres
Bandes de fréquences
Nom
Unités
Min
Max
Taille des pixels
Description
Mean
°C
-73.39*
37.64*
mètres
Valeur moyenne de la température de la surface terrestre la nuit pour chaque pixel agrégé.
FilledProportion
%
0*
100*
mètres
Bande de contrôle qualité qui indique le pourcentage de chaque pixel résultant composé de données brutes (par opposition aux estimations avec données manquantes).
Weiss, D.J., P.M. Atkinson, S. Bhatt, B. Mappin, S.I. Hay & P.W. Gething
(2014) An effective approach for gap-filling continental scale remotely
sensed time-series. ISPRS Journal of Photogrammetry and Remote Sensing,
98, 106-118.
L'ensemble de données sous-jacent pour ce produit nocturne est constitué des données de température de surface terrestre MODIS (MOD11A2), qui ont été complétées à l'aide de l'approche décrite dans Weiss et al. (2014) pour éliminer les données manquantes causées par des facteurs tels que la couverture nuageuse. Les sorties sans lacunes ont ensuite été agrégées de manière temporelle et spatiale pour produire les données mensuelles ≈5 km…
[null,null,[],[[["\u003cp\u003eThis dataset provides monthly nighttime land surface temperature data at a 5km resolution, derived from MODIS and gap-filled to address cloud cover issues.\u003c/p\u003e\n"],["\u003cp\u003eIt covers the period from March 2001 to June 2015 and was produced by the Oxford Malaria Atlas Project.\u003c/p\u003e\n"],["\u003cp\u003eThe data includes a mean temperature band and a quality control band indicating the proportion of gap-filled data.\u003c/p\u003e\n"],["\u003cp\u003eIt is licensed under CC-BY-NC-SA-4.0 and is available for exploration and analysis within Google Earth Engine.\u003c/p\u003e\n"],["\u003cp\u003eThe dataset is particularly useful for applications related to malaria research and other temperature-sensitive studies.\u003c/p\u003e\n"]]],[],null,["# Oxford MAP LST: Malaria Atlas Project Gap-Filled Nighttime Land Surface Temperature\n\nDataset Availability\n: 2001-03-01T00:00:00Z--2015-06-01T00:00:00Z\n\nDataset Provider\n:\n\n\n [Oxford Malaria Atlas Project](https://www.bdi.ox.ac.uk/research/malaria-atlas-project)\n\nCadence\n: 1 Month\n\nTags\n:\n[climate](/earth-engine/datasets/tags/climate) [lst](/earth-engine/datasets/tags/lst) [map](/earth-engine/datasets/tags/map) [oxford](/earth-engine/datasets/tags/oxford) [surface-temperature](/earth-engine/datasets/tags/surface-temperature) \n\n#### Description\n\nThe underlying dataset for this nighttime product is MODIS land surface\ntemperature data (MOD11A2), which was gap-filled using the approach outlined\nin Weiss et al. (2014) to eliminate missing data caused by factors such as\ncloud cover. Gap-free outputs were then aggregated temporally and spatially\nto produce the monthly ≈5km product.\n\nThis dataset was produced by Harry Gibson and Daniel Weiss of the\nMalaria Atlas Project (Big Data Institute, University of Oxford,\nUnited Kingdom, \u003chttps://malariaatlas.org/\u003e).\n\n### Bands\n\n\n**Pixel Size**\n\n5000 meters\n\n**Bands**\n\n| Name | Units | Min | Max | Pixel Size | Description |\n|--------------------|-------|----------|---------|------------|---------------------------------------------------------------------------------------------------------------------------------------------------|\n| `Mean` | °C | -73.39\\* | 37.64\\* | meters | The mean value of nighttime land surface temperature for each aggregated pixel. |\n| `FilledProportion` | % | 0\\* | 100\\* | meters | A quality control band that indicates the percentage of each resulting pixel that was comprised of raw data (as opposed to gap-filled estimates). |\n\n\\* estimated min or max value\n\n### Terms of Use\n\n**Terms of Use**\n\n[CC-BY-NC-SA-4.0](https://spdx.org/licenses/CC-BY-NC-SA-4.0.html)\n\n### Citations\n\nCitations:\n\n- Weiss, D.J., P.M. Atkinson, S. Bhatt, B. Mappin, S.I. Hay \\& P.W. Gething\n (2014) An effective approach for gap-filling continental scale remotely\n sensed time-series. ISPRS Journal of Photogrammetry and Remote Sensing,\n 98, 106-118.\n\n### Explore with Earth Engine\n\n| **Important:** Earth Engine is a platform for petabyte-scale scientific analysis and visualization of geospatial datasets, both for public benefit and for business and government users. Earth Engine is free to use for research, education, and nonprofit use. To get started, please [register for Earth Engine access.](https://console.cloud.google.com/earth-engine)\n\n### Code Editor (JavaScript)\n\n```javascript\nvar dataset = ee.ImageCollection('Oxford/MAP/LST_Night_5km_Monthly')\n .filter(ee.Filter.date('2015-01-01', '2015-12-31'));\nvar nighttimeLandSurfaceTemp = dataset.select('Mean');\nvar visParams = {\n min: -30.0,\n max: 30.0,\n palette: [\n '800080', '0000ab', '0000ff', '008000', '19ff2b', 'a8f7ff', 'ffff00',\n 'd6d600', 'ffa500', 'ff6b01', 'ff0000'\n ],\n};\nMap.setCenter(-88.6, 26.4, 1);\nMap.addLayer(\n nighttimeLandSurfaceTemp, visParams, 'Nighttime Land Surface Temperature');\n```\n[Open in Code Editor](https://code.earthengine.google.com/?scriptPath=Examples:Datasets/Oxford/Oxford_MAP_LST_Night_5km_Monthly) \n[Oxford MAP LST: Malaria Atlas Project Gap-Filled Nighttime Land Surface Temperature](/earth-engine/datasets/catalog/Oxford_MAP_LST_Night_5km_Monthly) \nThe underlying dataset for this nighttime product is MODIS land surface temperature data (MOD11A2), which was gap-filled using the approach outlined in Weiss et al. (2014) to eliminate missing data caused by factors such as cloud cover. Gap-free outputs were then aggregated temporally and spatially to produce the monthly ≈5km ... \nOxford/MAP/LST_Night_5km_Monthly, climate,lst,map,oxford,surface-temperature \n2001-03-01T00:00:00Z/2015-06-01T00:00:00Z \n-90 -180 90 180 \nGoogle Earth Engine \nhttps://developers.google.com/earth-engine/datasets\n\n- [](https://doi.org/https://www.bdi.ox.ac.uk/research/malaria-atlas-project)\n- [](https://doi.org/https://developers.google.com/earth-engine/datasets/catalog/Oxford_MAP_LST_Night_5km_Monthly)"]]