Page Summary
-
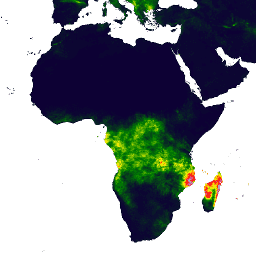
The dataset is called Climate Hazards Center InfraRed Precipitation with Station data (CHIRPS) and is a 30+ year quasi-global rainfall dataset available daily from 1981-01-01 to 2025-09-30.
-
CHIRPS combines 0.05° resolution satellite imagery with ground station data to produce gridded rainfall time series.
-
This dataset is suitable for trend analysis and seasonal drought monitoring.
-
The dataset is in the public domain with all copyright waived.
- Dataset Availability
- 1981-01-01T00:00:00Z–2026-06-30T00:00:00Z
- Dataset Producer
- UCSB/CHG
- Cadence
- 1 Day
- Tags
Description
Climate Hazards Center InfraRed Precipitation with Station data (CHIRPS) is a 30+ year quasi-global rainfall dataset. CHIRPS incorporates 0.05° resolution satellite imagery with in-situ station data to create gridded rainfall time series for trend analysis and seasonal drought monitoring.
Bands
Bands
Pixel size: 5566 meters (all bands)
| Name | Units | Min | Max | Pixel Size | Description |
|---|---|---|---|---|---|
precipitation |
mm/d | 0* | 1444.34* | 5566 meters | Precipitation |
Terms of Use
Terms of Use
This dataset is in the public domain. To the extent possible under law, Pete Peterson has waived all copyright and related or neighboring rights to Climate Hazards Center Infrared Precipitation with Stations (CHIRPS).
Citations
Funk, Chris, Pete Peterson, Martin Landsfeld, Diego Pedreros, James Verdin, Shraddhanand Shukla, Gregory Husak, James Rowland, Laura Harrison, Andrew Hoell & Joel Michaelsen. "The climate hazards infrared precipitation with stations-a new environmental record for monitoring extremes". Scientific Data 2, 150066. doi:10.1038/sdata.2015.66 2015.
Explore with Earth Engine
Code Editor (JavaScript)
var dataset = ee.ImageCollection('UCSB-CHG/CHIRPS/DAILY')
                  .filter(ee.Filter.date('2018-05-01', '2018-05-03'));
var precipitation = dataset.select('precipitation');
var precipitationVis = {
  min: 1,
  max: 17,
  palette: ['001137', '0aab1e', 'e7eb05', 'ff4a2d', 'e90000'],
};
Map.setCenter(17.93, 7.71, 2);
Map.addLayer(precipitation, precipitationVis, 'Precipitation');
import ee
import geemap.core as geemap
Colab (Python)
dataset = ee.ImageCollection('UCSB-CHG/CHIRPS/DAILY').filter(
    ee.Filter.date('2018-05-01', '2018-05-03')
)
precipitation = dataset.select('precipitation')
precipitation_vis = {
    'min': 1,
    'max': 17,
    'palette': ['001137', '0aab1e', 'e7eb05', 'ff4a2d', 'e90000'],
}

m = geemap.Map()
m.set_center(17.93, 7.71, 2)
m.add_layer(precipitation, precipitation_vis, 'Precipitation')
m