Climate Hazards Center InfraRed Temperature with Stations daily temperature data product (CHIRTS-daily; Verdin et al. 2020)는 준전역 고해상도 그리드 데이터 세트(0.05° × 0.05° 해상도, 60°S~70°N)로, 일일 최저 (Tmin) 및 최고 2미터 온도 (Tmax)와 포화 증기압 (SVP), 증기압 부족 (VPD), 상대 습도 (RH), 열 지수 (HI)의 네 가지 파생 변수를 제공합니다.
CHIRTS 온도 제품은 특히 관측소 밀도가 낮은 지역에서 온도 극단치와 변동성 분석을 지원하도록 설계되었습니다.
CHIRTS-daily는 고품질, 고해상도 월별 최고 온도 데이터 세트인 Climate Hazards Center InfraRed Temperature with Stations 월별 최고 온도 기후 기록(CHIRTSmax; Funk et al. 2019)을 유럽중기예보센터 (ECMWF) 재분석 v5 (ERA5)의 일일 온도와 병합하여 생성됩니다.
그 결과 월별 CHIRTSmax의 시공간 정보와 ERA5의 일일 및 일중 온도 변동성을 유지하는 고해상도 일일 온도 데이터 세트가 생성됩니다. 월별 CHIRTSmax는 다음을 기반으로 합니다.
지구 통계 회귀와 FAO 관측소 관측치, ERA5 온도, 기타 여러 지리적 예측 변수의 장기 평균을 사용하여 구성된 Tmax 기후학입니다.
약 15,000개의 현장 관측과 고해상도(0.05° × 0.05°) 위성 관측을 사용하여 Tmax 변동성을 추정합니다.
이 데이터는 버클리 지구 및 전 세계 통신 시스템 (GTS) 관측소 보고서와 클라우드 스크린 GridSat 정지궤도 위성 열 적외선 밝기 온도에서 가져온 것입니다.
일일 Tmax 값은 다운스케일된 ERA5 Tmax 이상치와 고해상도 CHIRTSmax를 사용하여 생성됩니다. 일일 Tmin 값은 다운스케일된 ERA5 일일 온도 범위 (Tmax - Tmin)를 제거하여 생성됩니다.
일일 SVP, VPD, RH, HI는 CHIRTS-daily Tmin 및 Tmax와 기타 기상 변수에 대한 시간별 ERA5 입력을 사용하여 계산됩니다(Williams 외, 2024년 참고). CHIRTS-daily 버전 1은 1983년부터 2016년까지의 기간을 다룹니다.
대역
픽셀 크기 5566미터
대역
이름
단위
최소
최대
픽셀 크기
설명
minimum_temperature
°C
미터
24시간 동안 지면에서 2m 높이에서 기록된 가장 낮은 공기 온도입니다.
maximum_temperature
°C
10*
40*
미터
24시간 동안 지표면 위 2m에서 기록된 최고 기온입니다.
saturation_vapor_pressure
kPa
미터
지상 2m에서 특정 온도와 압력으로 공기가 포함할 수 있는 최대 수증기량입니다.
vapor_pressure_deficit
kPa
미터
지상 2m에서의 포화 증기압과 실제 증기압의 차이입니다.
relative_humidity
%
미터
지상 2m에서 해당 온도와 압력(포화 수증기압)에서 공기가 포함할 수 있는 최대량에 대한 공기 중 실제 수증기량의 비율입니다.
heat_index
°F
미터
온도와 습도를 결합했을 때 얼마나 덥게 느껴지는지를 나타내는 측정값입니다.
* 예상 최솟값 또는 최댓값
이용약관
이용약관
이 데이터 세트는 공개 도메인에 있습니다. 법률에서 허용하는 범위 내에서 Chris Funk는 Climate Hazards InfraRed Temperature with Stations daily temperature data product (CHIRTS-daily)에 대한 모든 저작권 및 관련 권리 또는 인접 권리를 포기했습니다.
인용
인용:
Verdin, A., C. Funk, P. Peterson, M. Landsfeld, C. Tuholske, and Grace, K.,
2020년: CHIRTS-daily 준전역 고해상도 일일 온도 데이터 세트 개발 및 검증 Scientific Data, 7(1), 303.
doi: 10.1038/s41597-020-00643-7
Funk, C., P. Peterson, S. Peterson, S. Shukla,
F. Davenport, J. Michaelsen, K.R. Knapp, M. Landsfeld, G. Husak,
L. Harrison, J. Rowland, M. Budde, A. Meiburg, T. Dinku, D. Pedreros,
and N. Mata, 2019: 기후 위험 센터의 적외선 온도 및 관측소를 기반으로 한 고해상도 1983~2016년 Tmax 기후 데이터 기록 J. Climate, 32, 5639-5658.
doi:10.1175/JCLI-D-18-0698.1
Williams, E., C. Funk, P. Peterson, C. Tuholske (2024년). 열 관련 극단값 평가를 위한 고해상도 기후 변화 관측 및 예측 Scientific Data, 11(1), 261.
doi: 10.1038/s41597-024-03074-w
기상 위험 센터 적외선 온도 (CHIRTS-daily; Verdin et al. 2020)는 준전역 고해상도 그리드 데이터 세트 (0.05° × 0.05° 해상도, 60°S~70°N)로, 일일 최소 (Tmin) 및 최대 2미터 온도 (Tmax)와 포화 증기압 (SVP), 증기압 부족 등 4개의 파생 변수를 제공합니다.
[null,null,[],[[["\u003cp\u003eCHIRTS-daily provides daily minimum and maximum 2-meter temperatures globally at a 0.05° × 0.05° resolution from 1983 to 2016.\u003c/p\u003e\n"],["\u003cp\u003eThe dataset also includes derived variables: saturation vapor pressure, vapor pressure deficit, relative humidity, and heat index.\u003c/p\u003e\n"],["\u003cp\u003eCHIRTS-daily merges high-resolution monthly maximum temperatures with daily temperatures from the European Centre for Medium-Range Weather Forecasts (ECMWF) Reanalysis v5 (ERA5).\u003c/p\u003e\n"],["\u003cp\u003eThis dataset is designed to support the analysis of temperature extremes and variability, particularly in data-sparse regions.\u003c/p\u003e\n"],["\u003cp\u003eCHIRTS-daily is publicly available and provided by UCSB/CHG.\u003c/p\u003e\n"]]],[],null,["# CHIRTS-daily: Climate Hazards Center InfraRed Temperature with Stations daily temperature data product\n\nDataset Availability\n: 1983-01-01T00:00:00Z--2016-12-31T00:00:00Z\n\nDataset Provider\n:\n\n\n [UCSB/CHG](https://chc.ucsb.edu/data/chirtsdaily)\n\nCadence\n: 1 Day\n\nTags\n:\n[chg](/earth-engine/datasets/tags/chg) [climate](/earth-engine/datasets/tags/climate) [daily](/earth-engine/datasets/tags/daily) [era5](/earth-engine/datasets/tags/era5) [geophysical](/earth-engine/datasets/tags/geophysical) [reanalysis](/earth-engine/datasets/tags/reanalysis) [temperature](/earth-engine/datasets/tags/temperature) [ucsb](/earth-engine/datasets/tags/ucsb) [wind](/earth-engine/datasets/tags/wind) \n\n#### Description\n\nThe Climate Hazards Center InfraRed Temperature with Stations daily\ntemperature data product (CHIRTS-daily; Verdin et al. 2020) is a quasi\nglobal, high-resolution gridded dataset\n(0.05° × 0.05° resolution, 60°S - 70°N)\nthat provides daily minimum (Tmin) and maximum 2-meter temperatures (Tmax)\nand four derived variables: saturation vapor pressure (SVP),\nvapor pressure deficit (VPD), relative humidity (RH), and heat index (HI).\nCHIRTS temperature products are designed to support analysis of temperature\nextremes and variability, especially in regions with a low density of\nstation observations.\n\nCHIRTS-daily is created by merging a high-quality, high-resolution monthly\nmaximum temperature dataset, the Climate Hazards Center InfraRed\nTemperature with Stations monthly maximum temperature climate record\n(CHIRTSmax; Funk et al. 2019), with daily temperatures from the European\nCentre for Medium-Range Weather Forecasts (ECMWF) Reanalysis v5 (ERA5).\nThe result is a high-resolution, daily temperature dataset that maintains\nspatio-temporal information from monthly CHIRTSmax and the daily and diurnal\ntemperature variability from ERA5. Monthly CHIRTSmax are based on:\n\n1. A Tmax climatology constructed using geostatistical regressions and\n long-term averages of FAO station observations, ERA5 temperatures, and\n several other geographic predictors.\n\n2. Estimates of Tmax variability using approximately 15,000 in situ\n observations and high-resolution\n (0.05° × 0.05°) satellite observations.\n These data are from Berkeley Earth and Global Telecommunication\n System (GTS) station reports and cloud-screened GridSat geostationary\n satellite thermal infrared brightness temperatures.\n\nDaily Tmax values are produced using downscaled ERA5 Tmax anomalies and\nhigh-resolution CHIRTSmax. Daily Tmin values are created by removing the\ndownscaled ERA5 diurnal temperature range (Tmax - Tmin).\nDaily SVP, VPD, RH, and HI are computed using CHIRTS-daily Tmin and Tmax,\nalongside hourly ERA5 inputs for other meteorological variables\n(see Williams et al., 2024, for details). CHIRTS-daily, version 1, covers\nthe period from 1983 to 2016.\n\n### Bands\n\n\n**Pixel Size**\n\n5566 meters\n\n**Bands**\n\n| Name | Units | Min | Max | Pixel Size | Description |\n|-----------------------------|-------|------|------|------------|-------------------------------------------------------------------------------------------------------------------------------------------------------------------------------------|\n| `minimum_temperature` | °C | | | meters | The lowest air temperature recorded at 2 meters above the ground surface over a 24-hour period. |\n| `maximum_temperature` | °C | 10\\* | 40\\* | meters | The highest air temperature recorded at 2 meters above the ground surface over a 24-hour period. |\n| `saturation_vapor_pressure` | kPa | | | meters | The maximum amount of water vapor that the air can hold at a given temperature and pressure at 2 meters above ground. |\n| `vapor_pressure_deficit` | kPa | | | meters | The difference between the saturation vapor pressure and the actual vapor pressure at 2 meters above ground. |\n| `relative_humidity` | % | | | meters | The ratio of the actual amount of water vapor in the air to the maximum amount it could hold at that temperature and pressure (saturation vapor pressure) at 2 meters above ground. |\n| `heat_index` | °F | | | meters | A measure of how hot it feels when temperature and humidity are combined. |\n\n\\* estimated min or max value\n\n### Terms of Use\n\n**Terms of Use**\n\nThis datasets are in the public domain. To the extent possible under law,\n[Chris Funk](https://chc.ucsb.edu/people/chris-funk) has waived all\ncopyright and related or neighboring rights to Climate Hazards InfraRed\nTemperature with Stations daily temperature data product (CHIRTS-daily).\n\n### Citations\n\nCitations:\n\n- Verdin, A., C. Funk, P. Peterson, M. Landsfeld, C. Tuholske, and Grace, K.,\n 2020: Development and validation of the CHIRTS-daily quasi-global\n high-resolution daily temperature data set. Scientific Data, 7(1), 303.\n [doi: 10.1038/s41597-020-00643-7](https://doi.org/10.1038/s41597-020-00643-7)\n- Funk, C., P. Peterson, S. Peterson, S. Shukla,\n F. Davenport, J. Michaelsen, K.R. Knapp, M. Landsfeld, G. Husak,\n L. Harrison, J. Rowland, M. Budde, A. Meiburg, T. Dinku, D. Pedreros,\n and N. Mata, 2019: A High-Resolution 1983-2016 Tmax Climate Data Record\n Based on Infrared Temperatures and Stations by the Climate Hazard\n Center. J. Climate, 32, 5639-5658.\n [doi:10.1175/JCLI-D-18-0698.1](https://doi.org/10.1175/JCLI-D-18-0698.1)\n- Williams, E., C. Funk, P. Peterson, and C. Tuholske (2024). High\n resolution climate change observations and projections for the\n evaluation of heat-related extremes. Scientific Data, 11(1), 261.\n [doi: 10.1038/s41597-024-03074-w](https://doi.org/10.1038/s41597-024-03074-w)\n\n### DOIs\n\n- \u003chttps://doi.org/10.1038/s41597-024-03074-w\u003e\n- \u003chttps://doi.org/10.1175/JCLI-D-18-0698.1\u003e\n\n### Explore with Earth Engine\n\n| **Important:** Earth Engine is a platform for petabyte-scale scientific analysis and visualization of geospatial datasets, both for public benefit and for business and government users. Earth Engine is free to use for research, education, and nonprofit use. To get started, please [register for Earth Engine access.](https://console.cloud.google.com/earth-engine)\n\n### Code Editor (JavaScript)\n\n```javascript\n
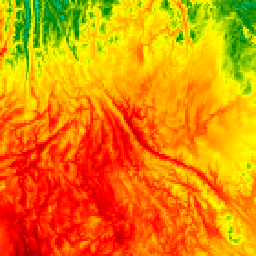
var dataset = ee.ImageCollection('UCSB-CHG/CHIRTS/DAILY')\n .filter(ee.Filter.date('2016-05-01', '2016-05-03'));\nvar maximumTemperature = dataset.select('maximum_temperature');\nvar visParams = {\n min: 10,\n max: 30,\n palette: ['darkblue', 'blue', 'cyan', 'green', 'yellow', 'orange', 'red','darkred'],\n};\nMap.setCenter(-104.28, 46.07, 3);\nMap.addLayer(maximumTemperature, visParams, 'Maximum temperature');\n```\n[Open in Code Editor](https://code.earthengine.google.com/?scriptPath=Examples:Datasets/UCSB-CHG/UCSB-CHG_CHIRTS_DAILY) \n[CHIRTS-daily: Climate Hazards Center InfraRed Temperature with Stations daily temperature data product](/earth-engine/datasets/catalog/UCSB-CHG_CHIRTS_DAILY) \nThe Climate Hazards Center InfraRed Temperature with Stations daily temperature data product (CHIRTS-daily; Verdin et al. 2020) is a quasi global, high-resolution gridded dataset (0.05° × 0.05° resolution, 60°S - 70°N) that provides daily minimum (Tmin) and maximum 2-meter temperatures (Tmax) and four derived variables: saturation vapor pressure (SVP), vapor pressure deficit ... \nUCSB-CHG/CHIRTS/DAILY, chg,climate,daily,era5,geophysical,reanalysis,temperature,ucsb,wind \n1983-01-01T00:00:00Z/2016-12-31T00:00:00Z \n-60 -180 70 180 \nGoogle Earth Engine \nhttps://developers.google.com/earth-engine/datasets\n\n- [https://doi.org/10.1175/JCLI-D-18-0698.1](https://doi.org/https://chc.ucsb.edu/data/chirtsdaily)\n- [https://doi.org/10.1175/JCLI-D-18-0698.1](https://doi.org/https://developers.google.com/earth-engine/datasets/catalog/UCSB-CHG_CHIRTS_DAILY)"]]