reviewsהשקת Places UI Kit: ספריית רכיבים מוכנה לשימוש בעלות נמוכה, שמאפשרת לכם להוסיף לכל מפה שתבחרו את ממשק המשתמש המוכר של 'מקומות' במפות Google. כדאי לנסות אותו ולשלוח לנו משוב כדי לעזור לנו לעצב את העתיד של GMP.
סקירה כללית
קל לארגן דפים בעזרת אוספים
אפשר לשמור ולסווג תוכן על סמך ההעדפות שלך.
עיצוב מבוסס-נתונים של מערכי נתונים מאפשר לכם להעלות מערכי נתונים גיאוספציאליים משלכם, להחיל סגנון מותאם אישית על מאפייני הנתונים שלהם ולהציג את מאפייני הנתונים האלה במפות. בעזרת סגנון מבוסס-נתונים של מערכי נתונים, אתם יכולים ליצור תרשימים להמחשת נתונים על סמך גיאומטריות של נקודות, קווים ופוליגונים, ולגרום לתכונות של הנתונים להגיב לאירועי קליקים. יש תמיכה בסגנון מבוסס-נתונים של מערכי נתונים רק במפות וקטוריות (נדרש מזהה מפה).
תחילת העבודה עם עיצוב מבוסס-נתונים של מערכי נתונים
הוספת מערכי נתונים גיאו-מרחביים בהתאמה אישית
מוסיפים את הנתונים בהתאמה אישית באמצעות מסוף Google Cloud או Google Cloud Shell. לכל מערך נתונים יש מזהה ייחודי שאפשר לשייך לסגנון מפה.
הפורמטים הבאים של נתונים נתמכים:
- GeoJSON
- מופרד בפסיקים (CSV)
- KML
מידע נוסף על הדרישות והמגבלות של מערכי נתונים זמין במאמר יצירה וניהול של מערך נתונים.
תכונות של נתוני סגנון
אחרי שמעלים את הנתונים המותאמים אישית ומשייכים אותם לסגנון מפה ולמזהה מפה, אפשר להחיל סגנון על תכונות הנתונים כדי ליצור השפעה ויזואלית, ולגרום לתכונות להגיב לאירועי קליק.
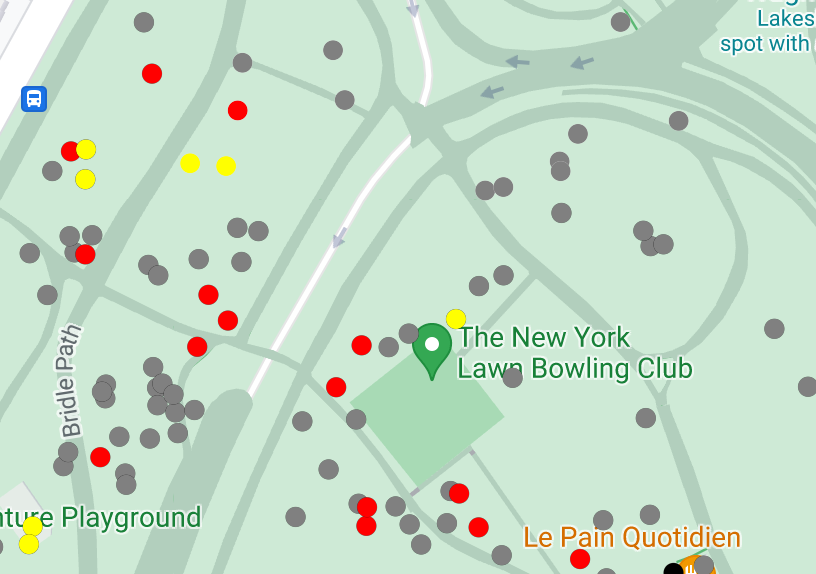
אפשר להגדיר סגנון לנתוני נקודות כדי להציג מיקומים ספציפיים במפה.
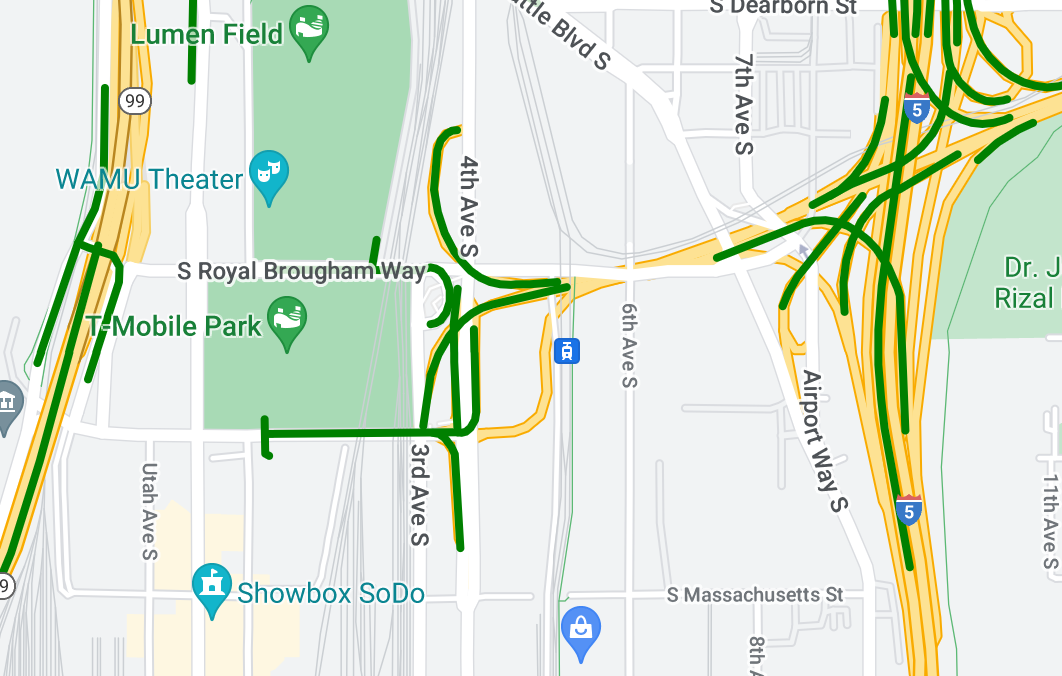
החלת סגנון על נתוני קו שבור כדי להדגיש מאפיינים גיאוגרפיים.
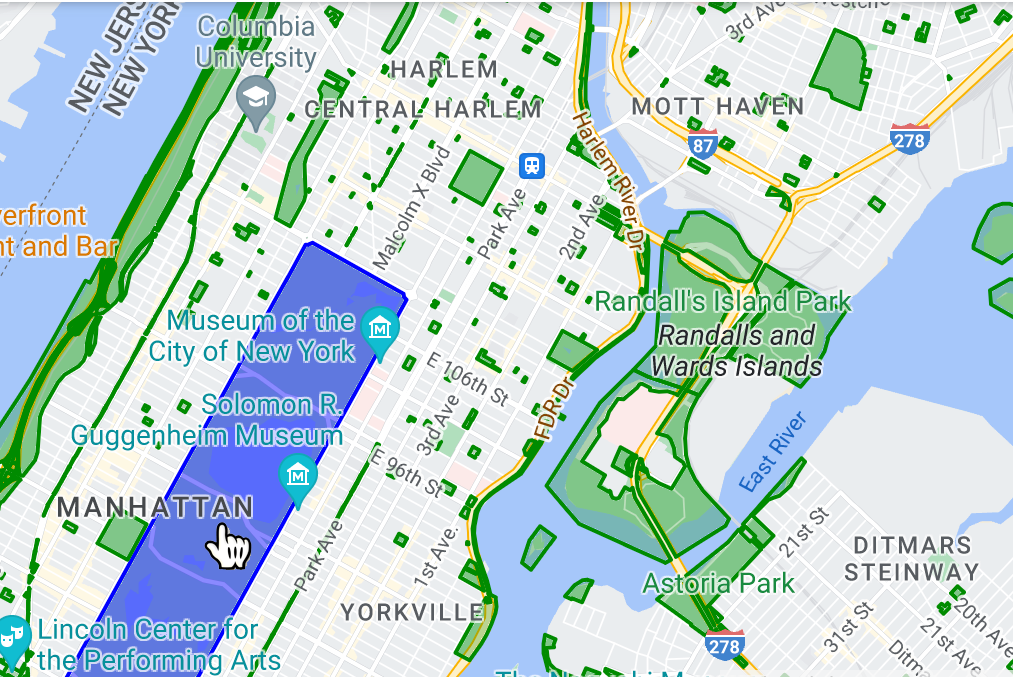
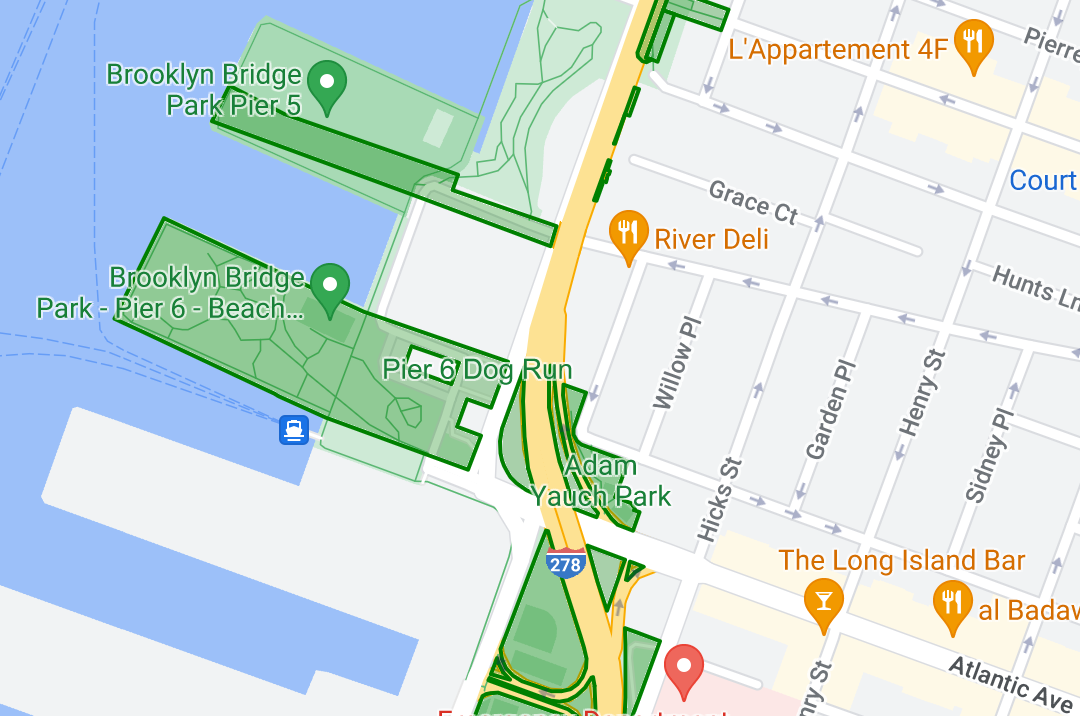
עיצוב נתוני פוליגונים כדי להדגיש אזורים גיאוגרפיים.
כדי לגרום לתכונות של נתונים להגיב לאירועי קליקים, מוסיפים מאזין לאירועים.
אלא אם צוין אחרת, התוכן של דף זה הוא ברישיון Creative Commons Attribution 4.0 ודוגמאות הקוד הן ברישיון Apache 2.0. לפרטים, ניתן לעיין במדיניות האתר Google Developers. Java הוא סימן מסחרי רשום של חברת Oracle ו/או של השותפים העצמאיים שלה.
עדכון אחרון: 2025-08-31 (שעון UTC).
[null,null,["עדכון אחרון: 2025-08-31 (שעון UTC)."],[[["\u003cp\u003eData-driven styling allows you to upload custom geospatial datasets (GeoJSON, CSV, KML) and visualize them on vector maps using points, polylines, and polygons.\u003c/p\u003e\n"],["\u003cp\u003eDatasets are managed through Google Cloud Console or Google Cloud Shell and are associated with map styles and IDs for display.\u003c/p\u003e\n"],["\u003cp\u003eYou can customize the visual appearance of data features based on their properties and enable click event interactions.\u003c/p\u003e\n"],["\u003cp\u003eData-driven styling enables the creation of dynamic and interactive data visualizations for highlighting locations, geographical features, and areas on maps.\u003c/p\u003e\n"]]],[],null,["Select platform: [Android](/maps/documentation/android-sdk/dds-datasets/overview \"View this page for the Android platform docs.\") [iOS](/maps/documentation/ios-sdk/dds-datasets/overview \"View this page for the iOS platform docs.\") [JavaScript](/maps/documentation/javascript/dds-datasets/overview \"View this page for the JavaScript platform docs.\")\n\n\u003cbr /\u003e\n\nData-driven styling for datasets lets you upload your own geospatial datasets,\napply custom styling to their data features, and display those data features on\nmaps. With data-driven styling for datasets, you can create data visualizations\nbased on point, polyline, and polygon geometries, and make data features respond\nto click events. Data-driven styling for datasets is supported on vector maps\nonly (a map ID is required).\n\n[Get started with data-driven styling for datasets](/maps/documentation/javascript/dds-datasets/start)\n\nAdd custom geospatial datasets\n\nAdd your custom data using Google Cloud Console or Google Cloud\nShell. Each dataset has a unique ID, which you can associate with a map style.\nThe following data formats are supported:\n\n- GeoJSON\n- Comma-separated (CSV)\n- KML\n\nFor details about dataset requirements and limitations, see\n[Create and manage a dataset](/maps/documentation/javascript/dds-datasets/create-dataset#dataset-prerequisites)\n\nStyle data features\n\nOnce your custom data has been uploaded and associated to a map\nstyle and map ID, you can style data features for visual impact, and make\nfeatures respond to click events.\n\nStyle point data to show specific locations on the map.\n\nStyle polyline data to highlight geographical features.\n\nStyle polygon data to highlight geographical areas.\n\nMake data features respond to click events by adding an event\nlistener."]]