ElevationElement 是 HTML 元素,可顯示單一點或折線的海拔資料。這個圖表會顯示
path 屬性中設定路徑的海拔高度,並提供經緯度座標陣列。線段會在陣列的點之間插值,因此即使點數不多,仍會產生詳細的海拔高度圖。
使用座標設定路徑海拔高度
以下範例使用 gmp-elevation 元素,根據一組座標,顯示所選兩點之間路徑的海拔高度。
使用
unit-system 屬性,為指標評估設定元素:
<gmp-elevation unit-system="metric"></gmp-elevation>
querySelector 用於選取海拔高度元素,並使用經緯度座標設定其 path 屬性:
/** Maps JS loaded callback */
async function init() {
  // Load the Elevation Element from Maps JS
  const {ElevationElement} = await google.maps.importLibrary('elevation');

  // Specify an elevation path to render
  const elevationElement = document.querySelector('gmp-elevation');
  elevationElement.path = [
    {lat: 37.4523, lng: -122.2645},
    {lat: 37.377, lng: -122.4078},
  ];
}
查看完整程式碼範例
JavaScript
/** Maps JS loaded callback */
async function init() {
  // Load the Elevation Element from Maps JS
  const {ElevationElement} = await google.maps.importLibrary('elevation');

  // Specify an elevation path to render
  const elevationElement = document.querySelector('gmp-elevation');
  elevationElement.path = [
    {lat: 37.4523, lng: -122.2645},
    {lat: 37.377, lng: -122.4078},
  ];
}

init();
CSS
html, body {
  margin: 0;
  padding: 0;
}

gmp-elevation {
  width: 100%;
  height: 100%;
}

.overlay {
  margin: 20px;
  width: 400px;
}
HTML
<!DOCTYPE html>
<html>
<head>
<title>Simple Elevation</title>
<meta charset="utf-8">
<link rel="stylesheet" type="text/css" href="style.css">
</head>
<body>
<h1>Path elevation</h1>
<div class="overlay">
<gmp-elevation unit-system="metric"></gmp-elevation>
</div>
<script>
(g=>{var h,a,k,p="The Google Maps JavaScript API",c="google",l="importLibrary",q="__ib__",m=document,b=window;b=b[c]||(b[c]={});var d=b.maps||(b.maps={}),r=new Set,e=new URLSearchParams,u=()=>h||(h=new Promise(async(f,n)=>{await (a=m.createElement("script"));e.set("libraries",[...r]+"");for(k in g)e.set(k.replace(/[A-Z]/g,t=>"_"+t[0].toLowerCase()),g[k]);e.set("callback",c+".maps."+q);a.src=`https://maps.${c}apis.com/maps/api/js?`+e;d[q]=f;a.onerror=()=>h=n(Error(p+" could not load."));a.nonce=m.querySelector("script[nonce]")?.nonce||"";m.head.append(a)}));d[l]?console.warn(p+" only loads once. Ignoring:",g):d[l]=(f,...n)=>r.add(f)&&u().then(()=>d[l](f,...n))})({
key: "YOUR_API_KEY",
v: "alpha"
});
</script>
</body>
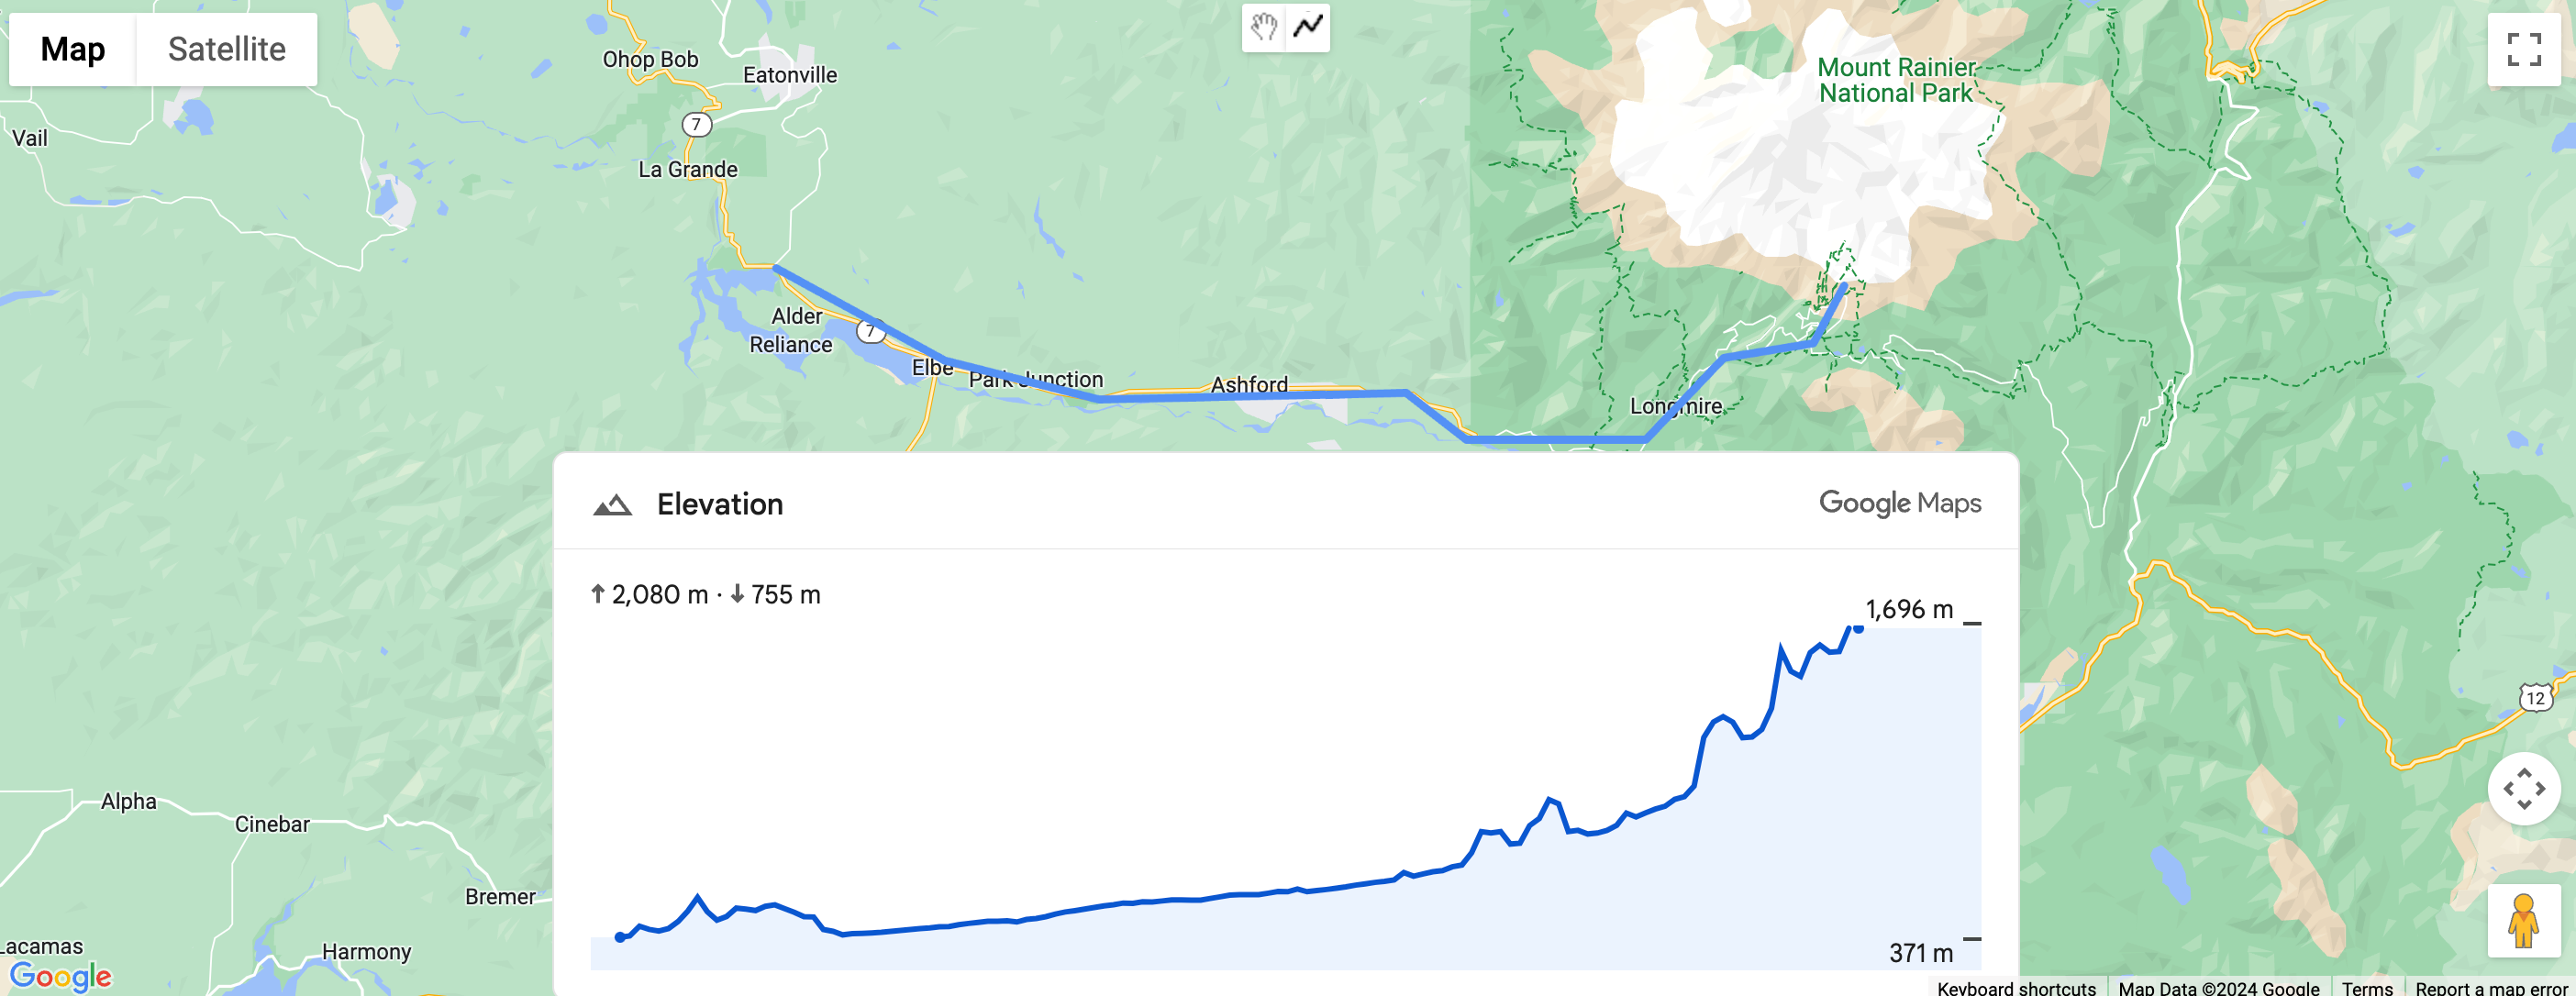
</html>使用折線設定路徑海拔高度
以下範例會根據使用者繪製的折線,顯示路徑的海拔高度。使用 polyline.getPath().getArray() 從使用者的折線取得
path:
elevationElem.path = polyline.getPath().getArray();
查看完整程式碼範例
JavaScript
const map = document.querySelector('gmp-map');
const elevationElem = document.querySelector('gmp-elevation');

async function init() {
  await google.maps.importLibrary('places');
  await google.maps.importLibrary('marker');
  await google.maps.importLibrary('elevation');


  map.innerMap.setOptions({'mapTypeControl': true, 'clickableIcons': false});

  findCurrentLocation();
  drawPolyline();
}

async function drawPolyline() {
  const {DrawingManager} = await google.maps.importLibrary('drawing');
  const drawingManager = new DrawingManager({
    drawingMode: google.maps.drawing.OverlayType.POLYLINE,
    drawingControl: true,
    drawingControlOptions: {
      position: google.maps.ControlPosition.TOP_CENTER,
      drawingModes: [google.maps.drawing.OverlayType.POLYLINE]
    },
    polylineOptions: {geodesic: true, strokeColor: '#5491f5', strokeWeight: 6}
  });

  drawingManager.setMap(map.innerMap);

  drawingManager.addListener('polylinecomplete', (polyline) => {
    console.log('complete');
    console.log(polyline.getPath().getArray());
    elevationElem.path = polyline.getPath().getArray();
    polyline.addListener('click', (e) => {
      console.log(e);
    });
  });
}

async function findCurrentLocation() {
  const {LatLng} = await google.maps.importLibrary('core');
  if (navigator.geolocation) {
    navigator.geolocation.getCurrentPosition(
        (position) => {
          const pos =
              new LatLng(position.coords.latitude, position.coords.longitude);
          map.innerMap.panTo(pos);
          map.innerMap.setZoom(16);
        },
        () => {
          console.log('The Geolocation service failed.');
          map.innerMap.setZoom(16);
        },
    );
  } else {
    console.log(`Your browser doesn't support geolocation`);
    map.innerMap.setZoom(16);
  }
}

init();
CSS
html, body {
    height: 100%;
    margin: 0;
}

body {
    display: flex;
    flex-direction: column;
    font-family: Arial, Helvetica, sans-serif;
}

h1 {
    font-size: 16px;
    text-align: center;
}

gmp-map {
    box-sizing: border-box;
    margin-top: 20px;
    width: 100%;
    height: 100%;
}

gmp-elevation {
    width: 100%;
    height: 300px;
}

.overlay {
    width: 800px;
}
HTML
<!DOCTYPE html>
<html>
  <head>
    <title>Path Elevation</title>
    <meta charset="utf-8">
    <link rel="stylesheet" type="text/css" href="style.css">
  </head>
  <body>
    <h1>Draw polyline and get path elevation</h1>
    <gmp-map center="-37.813,144.963" zoom="12" map-id="DEMO_MAP_ID">
        <div id="elevation-container" class="overlay" slot="control-block-end-inline-center">
          <gmp-elevation unit-system="metric"></gmp-elevation>
        </div>
    </gmp-map>
    <script>
      (g=>{var h,a,k,p="The Google Maps JavaScript API",c="google",l="importLibrary",q="__ib__",m=document,b=window;b=b[c]||(b[c]={});var d=b.maps||(b.maps={}),r=new Set,e=new URLSearchParams,u=()=>h||(h=new Promise(async(f,n)=>{await (a=m.createElement("script"));e.set("libraries",[...r]+"");for(k in g)e.set(k.replace(/[A-Z]/g,t=>"_"+t[0].toLowerCase()),g[k]);e.set("callback",c+".maps."+q);a.src=`https://maps.${c}apis.com/maps/api/js?`+e;d[q]=f;a.onerror=()=>h=n(Error(p+" could not load."));a.nonce=m.querySelector("script[nonce]")?.nonce||"";m.head.append(a)}));d[l]?console.warn(p+" only loads once. Ignoring:",g):d[l]=(f,...n)=>r.add(f)&&u().then(()=>d[l](f,...n))})({
        key: "YOUR_API_KEY",
        v: "alpha"
      });
    </script>
  </body>
</html>