最適化の出力を生成するには、次の複数の方法があります。
カスタムの期間を指定して 2 ページの HTML 最適化レポートを生成し、HTML 出力を Google ドライブにエクスポートしてチームと共有します。
最適化の結果の概要を生成して、レポートや可視化データをカスタマイズしたり、別の形式にエクスポートしたりできます。こうしたメディア指標の数値の概要から、詳細を確認できます。
最適化の可視化データをプロットすることもできます。詳細については、最適化の可視化データのプロットをご確認ください。
最適化の HTML レポートを生成する
次のコードを実行すると、最適化 HTML を生成できます。
Colab を使用してレポートを Google ドライブにエクスポートする場合は、Google ドライブを Colab ノートブックにマウントします。
from google.colab import drive drive.mount('/content/drive')BudgetOptimizerクラスをインスタンス化し、optimize()メソッドを実行します。前のセクションで説明したように、最適化をカスタマイズすることもできます。budget_optimizer = optimizer.BudgetOptimizer(meridian) optimization_results = budget_optimizer.optimize()ファイル名とパスを
output_model_results_summaryに渡して、最適化の概要を生成し、指定したファイルに保存します。例:
filepath = '/content/drive/MyDrive'
optimization_results.output_optimization_summary(f'{FILENAME}.html', filepath)
ここで
filepathは、ファイルを保存する Google ドライブ内のパスです。FILENAMEは、ファイルに指定する名前(例:optimization_output.html)です。ファイルの拡張子は HTML にする必要があります。
HTML レポートが生成され、指定したファイルの場所に保存されます。
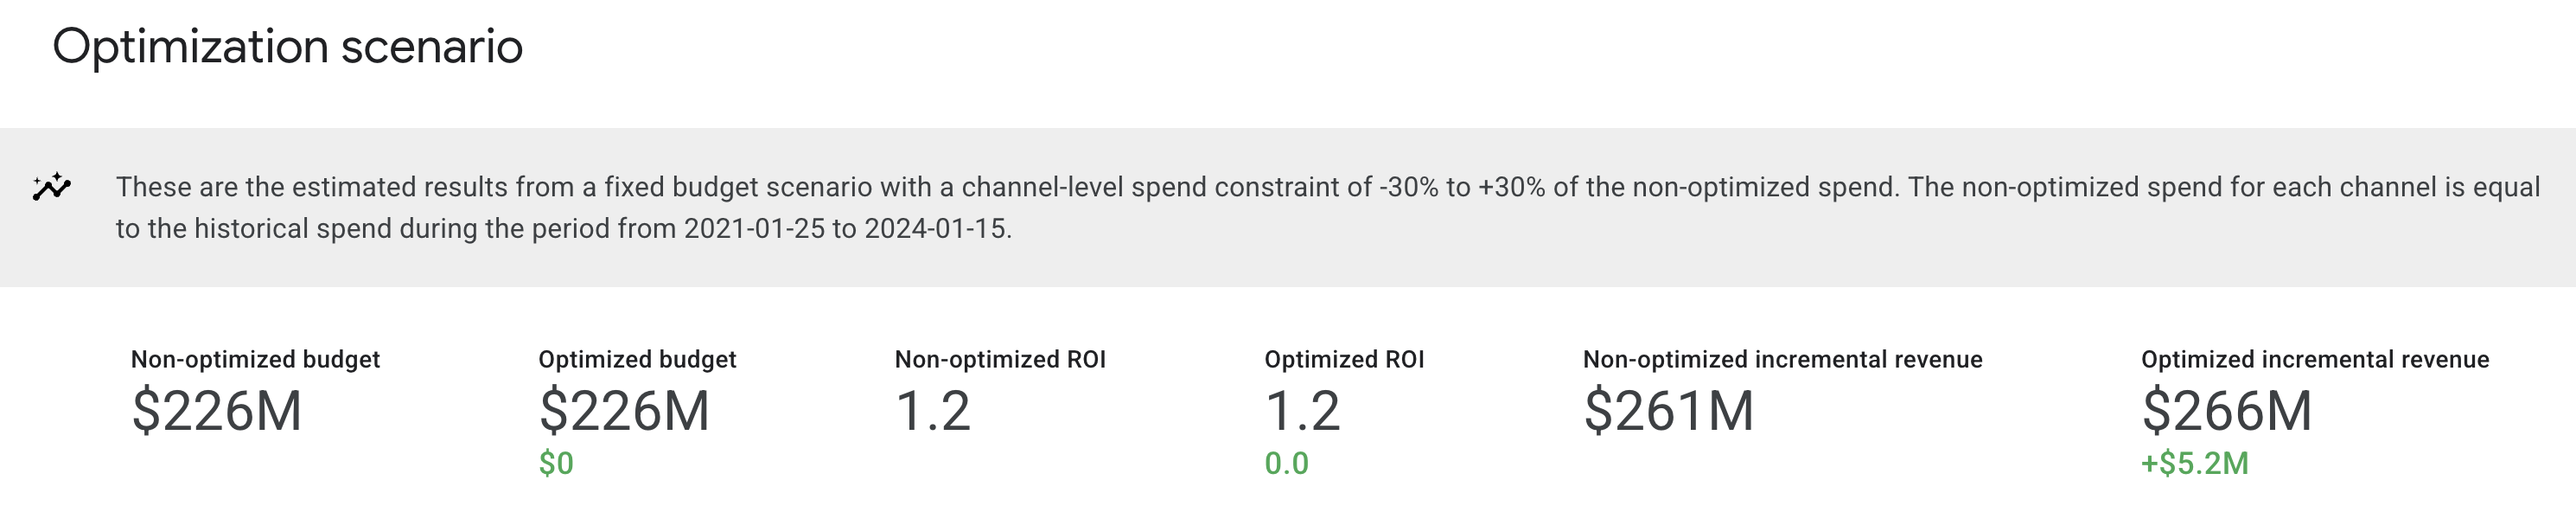
最適化シナリオのプラン
最適化シナリオのプランのセクションには、最適化された予算、費用対効果、収益または KPI の増分が表示されます。また、このセクションでは、チャネルレベルで費用に適用される制約と、予算の最適化のベンチマーク期間も表示されます。
出力例:(画像をクリックして拡大)
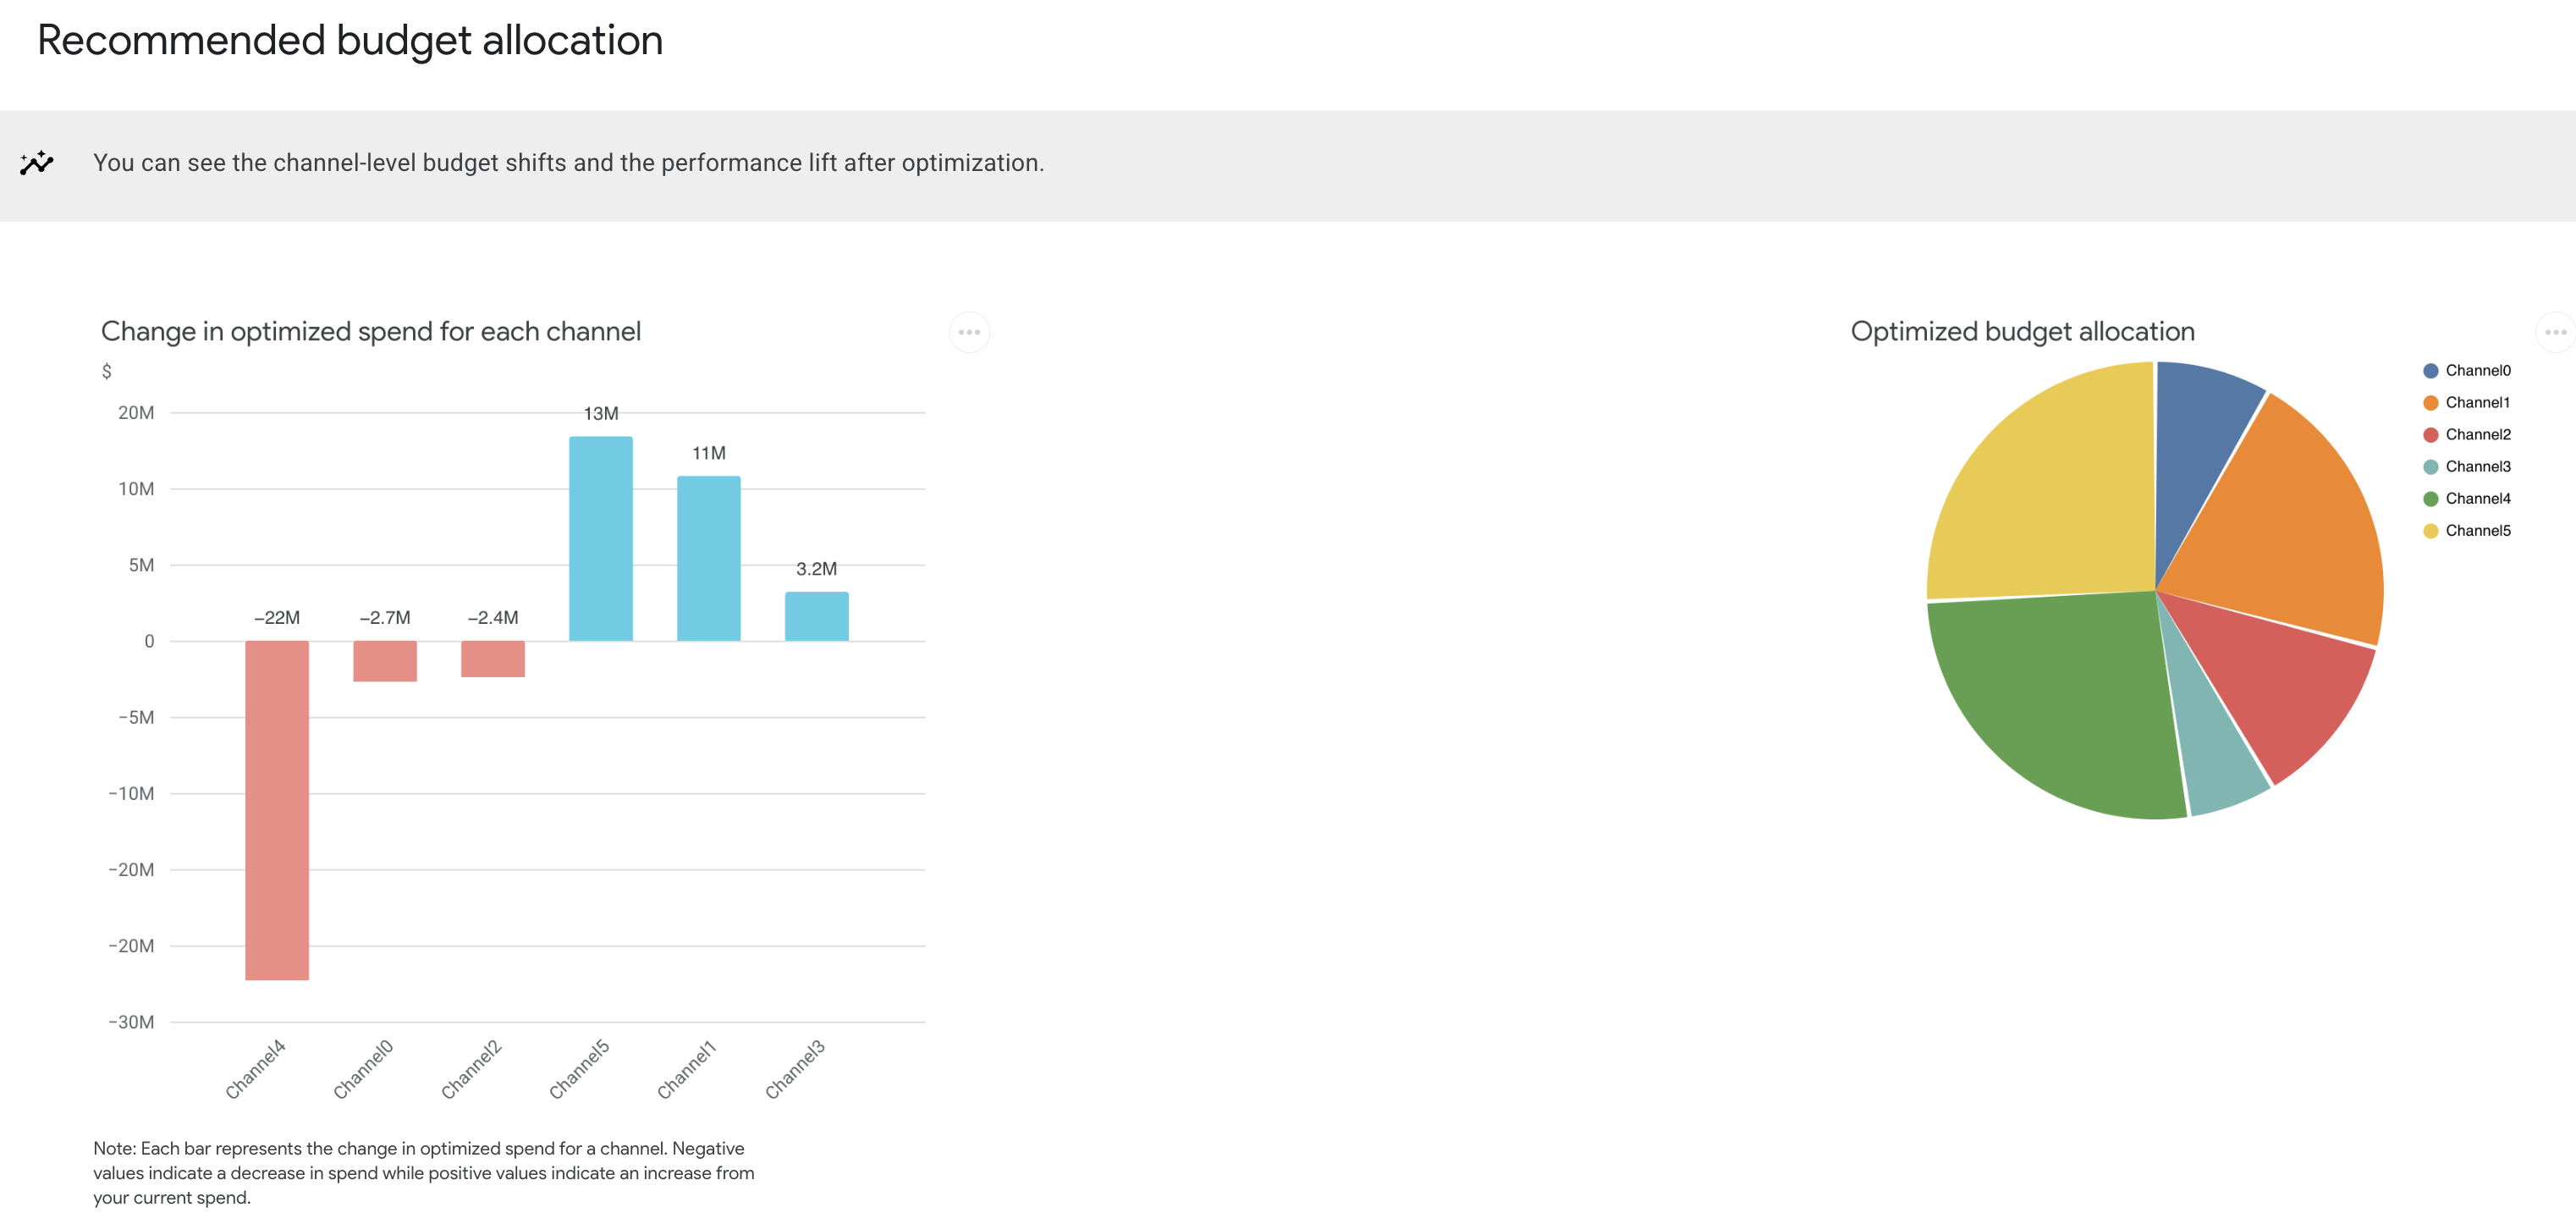
推奨の予算配分
推奨の予算配分のグラフには、各チャネルの最適化された費用の変化が表示されます。このセクションには、現在の費用と最適化された費用の間で、各チャネルの収益または KPI の増分にどの程度の差異が生まれるのかも表示されます。
出力例:(画像をクリックして拡大)
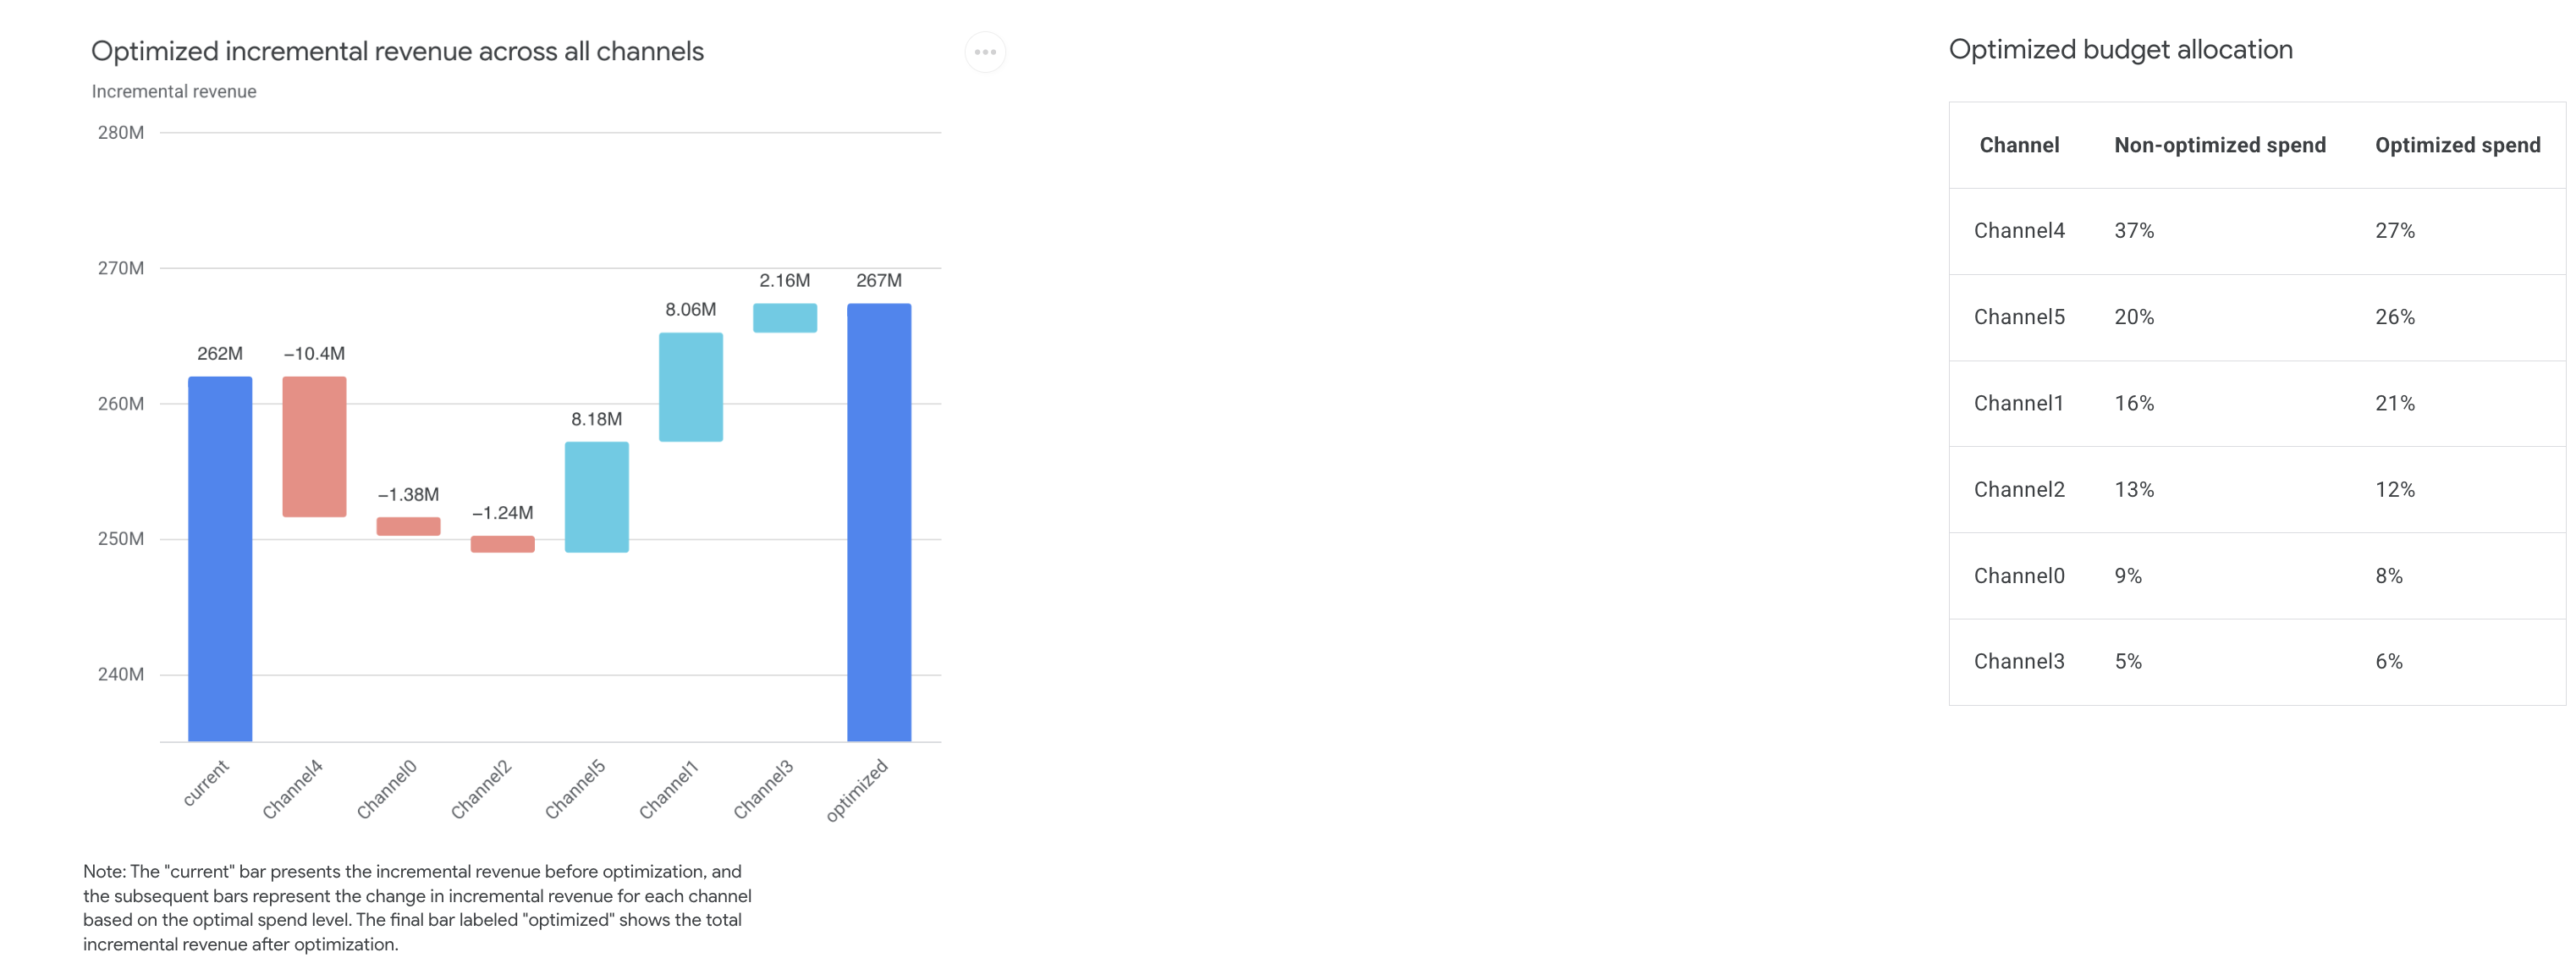
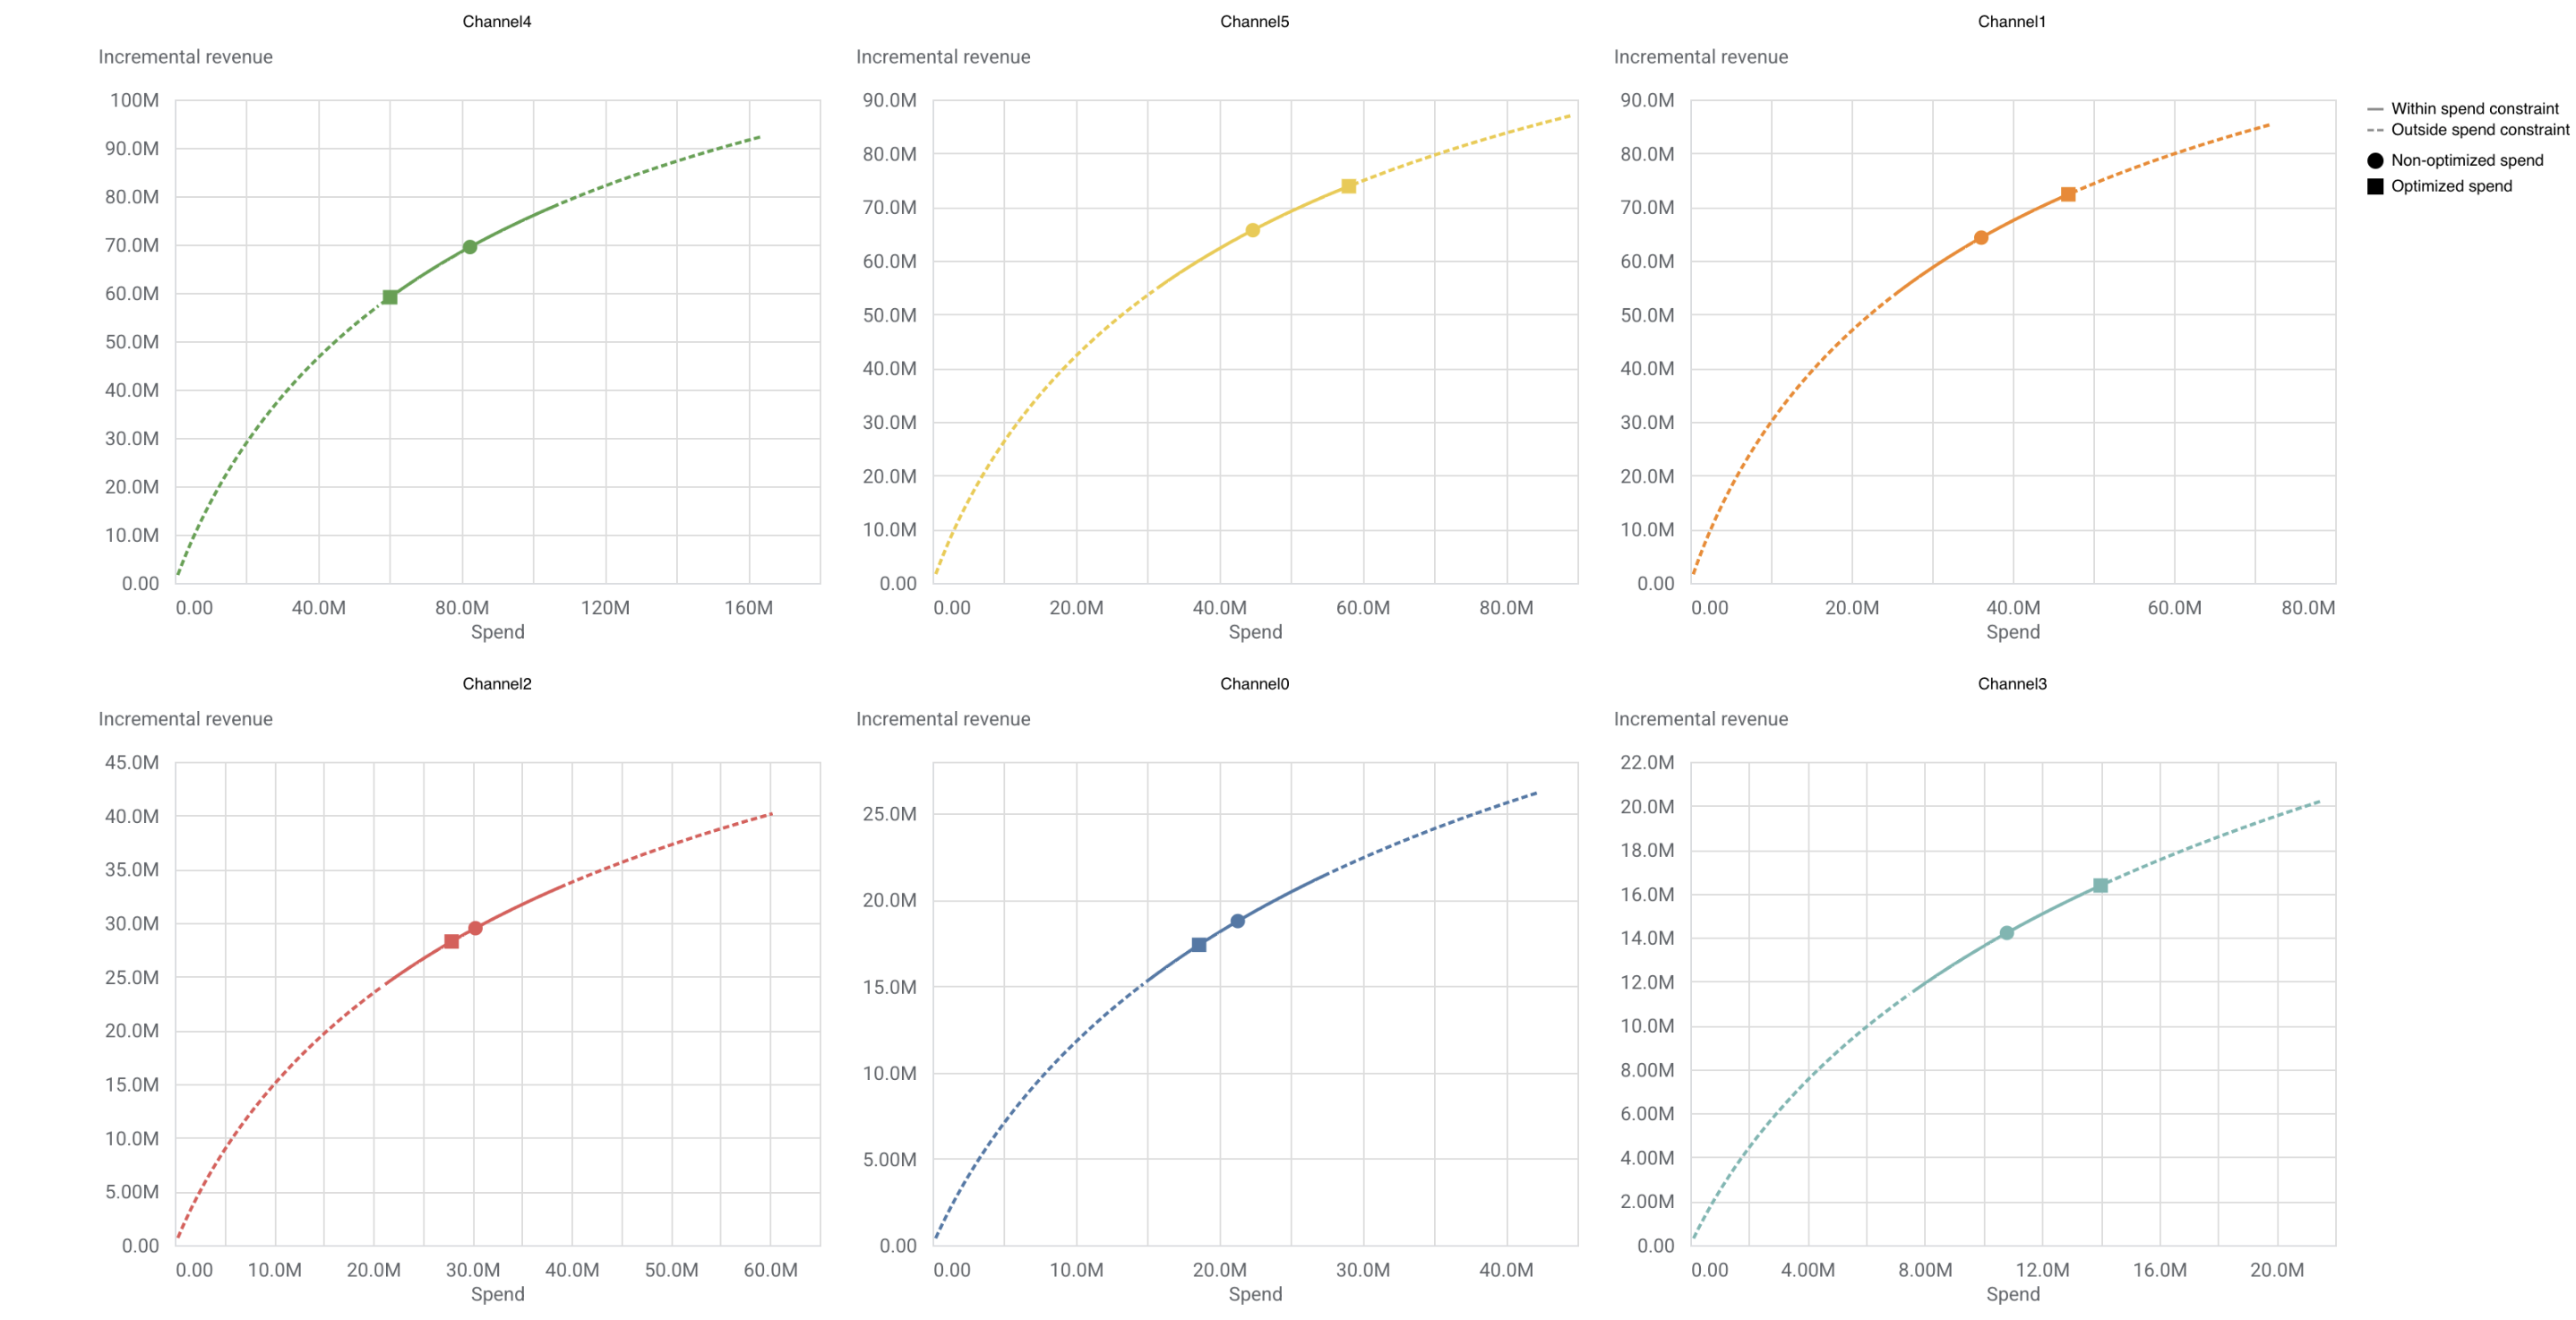
チャネル別の最適化された応答曲線
チャネル別の最適化された応答曲線のセクションでは、応答曲線上に、チャネル単位の現在の費用と最適化された費用が表示されます。
出力例:(画像をクリックして拡大)
最適化結果の概要を生成
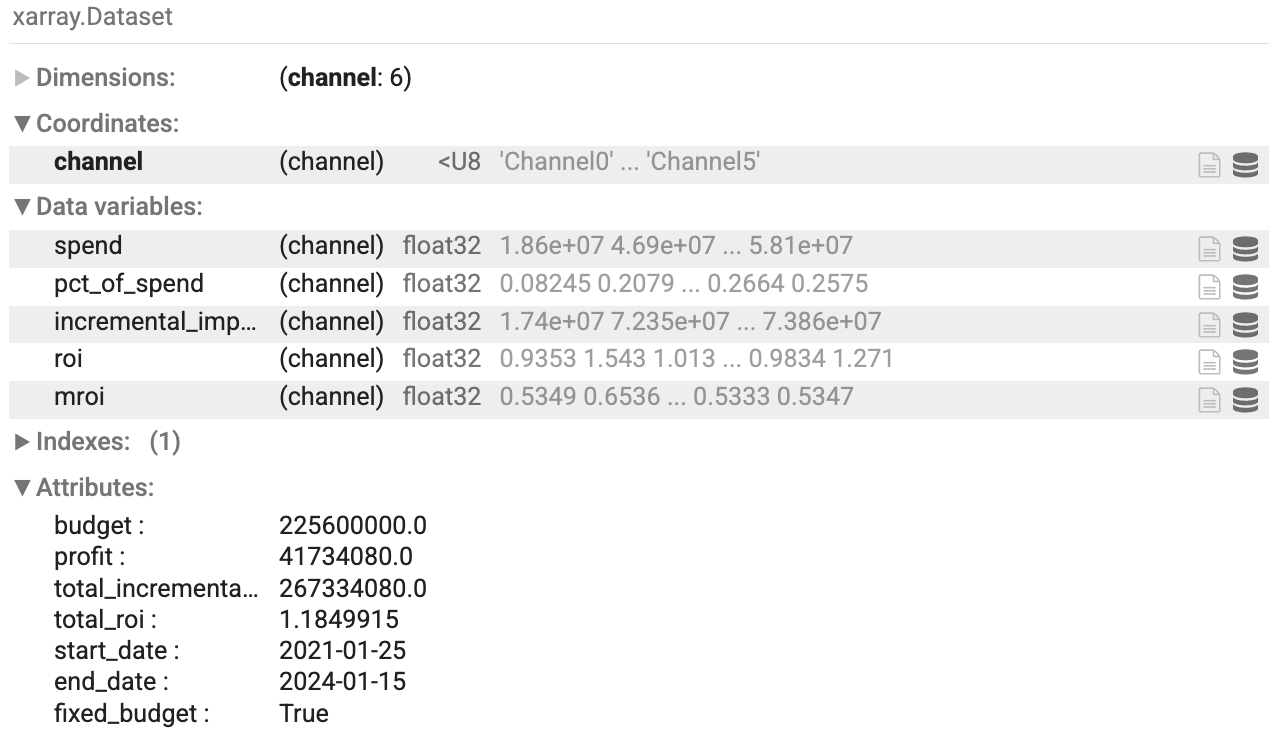
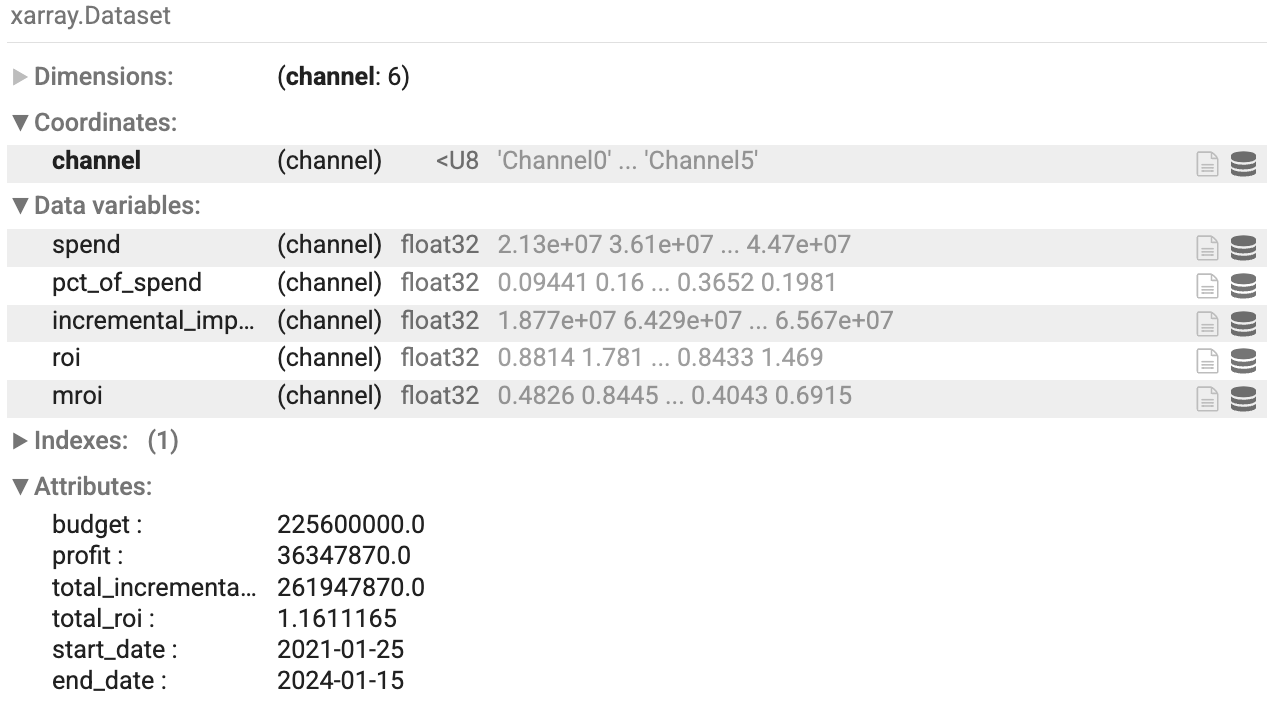
最適化しない場合のデータと最適化した場合のデータの概要を生成して、レポートや可視化データをカスタマイズしたり、別の形式にエクスポートしたりできます。これらの数値の概要では、結果をチャネル別に分類して詳細を把握できるため、最適化された結果と最適化されていない結果を比較できます。
これらのデータの概要は、optimize() メソッドによって返されるデータクラス コンテナ OptimizationResults 内で使用できます。
最適化しない場合の概要
次のコマンドを実行すると、最適化しない場合のデータの概要を生成できます。
optimization_results.nonoptimized_data
出力例:
最適化の概要
次のコマンドを実行すると、最適化した場合のデータの概要を生成できます。
optimization_results.optimized_data
出力例: