Stay organized with collections
Save and categorize content based on your preferences.
The simulator in the Actions console
lets you test your Action through an easy-to-use web interface that lets you
simulate hardware devices and their settings. You can also access debug
information such as the request and response that your fulfillment receives
and sends.
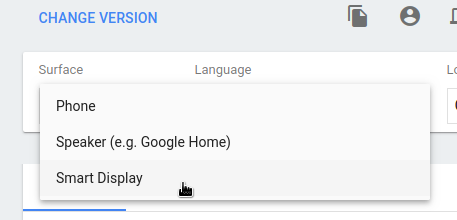
To test your Interactive Canvas Action in the simulator, you should select either
the Smart Display or Phone option. These options allow you to see how
your Action appears on devices with screens.
To use the simulator, follow these steps:
Make sure the most recent version of your code is deployed through Dialogflow's inline code editor.
Under Suggested input, click the suggestion chip that says Talk to my
test app to begin a conversation with your agent. You can also type Talk
to my test app and press enter in the Input field.
Debug your Action
The debug tab in the simulator shows the actual payload the Google Assistant
sends to your fulfillment in the assistantToAgentJson object
(see the request reference documentation)
and the response from your fulfillment in the agentToAssistant object
(see the response
reference documentation).
To copy the debug information to your clipboard, click on the clipboard icon
at the top right of the JSON debug information panel.
You can also use Chrome DevTools
to debug the iframe that hosts the web app on the simulator web page.
[null,null,["Last updated 2024-09-18 UTC."],[[["\u003cp\u003eThe Actions console simulator provides a web interface for testing Actions, offering device simulation and debug information access.\u003c/p\u003e\n"],["\u003cp\u003eTo test Interactive Canvas Actions, select either the Smart Display or Phone option for device surface visualization.\u003c/p\u003e\n"],["\u003cp\u003eDebugging tools include access to request/response payloads in the debug tab and Chrome DevTools for web app debugging within the simulator.\u003c/p\u003e\n"],["\u003cp\u003eInitiating a conversation with your agent within the simulator is achieved by selecting the "Talk to my test app" suggestion or manually typing the phrase.\u003c/p\u003e\n"],["\u003cp\u003eEnsuring the latest code deployment and navigating to the "Test" section within the Actions console are prerequisites for simulator usage.\u003c/p\u003e\n"]]],[],null,["# Actions simulator (Dialogflow)\n\nThe simulator in the [Actions console](https://console.actions.google.com)\nlets you test your Action through an easy-to-use web interface that lets you\nsimulate hardware devices and their settings. You can also access debug\ninformation such as the request and response that your fulfillment receives\nand sends.\n\nTo test your Interactive Canvas Action in the simulator, you should select either\nthe **Smart Display** or **Phone** option. These options allow you to see how\nyour Action appears on devices with screens.\n| **Note:** Interactive Canvas currently only works on Android phones.\n\nTo use the simulator, follow these steps:\n\n1. Make sure the most recent version of your code is deployed through Dialogflow's inline code editor.\n2. Navigate to the [Actions console](https://console.actions.google.com).\n3. Click **Test** in the top menu.\n4. Choose **Smart Display** or **Phone** under **Surface**.\n\n5. Under **Suggested input** , click the suggestion chip that says `Talk to my\n test app` to begin a conversation with your agent. You can also type `Talk\n to my test app` and press enter in the **Input** field.\n\nDebug your Action\n-----------------\n\nThe **debug** tab in the simulator shows the actual payload the Google Assistant\nsends to your fulfillment in the `assistantToAgentJson` object\n(see the [request](/assistant/conversational/webhook/reference/rest/Shared.Types/AppRequest) reference documentation)\nand the response from your fulfillment in the `agentToAssistant` object\n(see the [response](/assistant/conversational/webhook/reference/rest/Shared.Types/AppResponse)\nreference documentation).\n\nTo copy the debug information to your clipboard, click on the **clipboard icon**\nat the top right of the JSON debug information panel.\n\nYou can also use [Chrome DevTools](/web/tools/chrome-devtools)\nto debug the iframe that hosts the web app on the simulator web page."]]