- データセットの可用性
- 2019-04-17T00:00:00Z–2023-03-16T00:00:00Z
- データセット プロバイダ
- ラスタライズ: Google と USFS Laboratory for Applications of Remote Sensing in Ecology(LARSE) グリッド化された GEDI 植生構造指標とバイオマス密度
- タグ
説明
このデータセットは、NASA の地球規模生態系ダイナミクス調査(GEDI)のレベル 2 および 4A のプロダクトから導出された、ほぼ地球規模の分析可能な多重解像度グリッド化された植生構造指標で構成されています。これらの指標は、直径 25 m の LiDAR フットプリントに関連付けられています。このデータセットは、GEDI ライダーのみに基づいて、垂直方向のプロファイル全体を含む、ほぼ地球規模の植生構造を包括的に表現したもので、独立したデータで検証されています。
国際宇宙ステーション(ISS)に搭載された GEDI センサーは、地球表面で軌道に沿って 60 m、軌道に直交して 600 m の間隔で配置された 8 本のレーザービームを使用して、北緯約 52 度から南緯約 52 度の間の地盤の標高と植生構造を測定します。2019 年 4 月 17 日から 2023 年 3 月 16 日までの間に、GEDI はそれぞれ地表の標高と植生の構造の測定に適した 110 億個と 77 億個の高品質な波形を取得しました。
標準的な L2 および L4A のショット指標に加えて、地球システム モデルの炭素循環プロセスや水循環プロセス、森林管理、生物多様性モデリング、生息地の評価などのアプリケーションに特に役立つ可能性のある、いくつかの追加の指標が導出されています。変数には、樹冠の高さ、樹冠被覆率、植物面積指数、葉の高さの多様性、5 m 階層での植物面積体積密度が含まれます。詳しくは、グリッド化された GEDI 植生構造指標とバイオマス密度をご覧ください。
GEDI ショット指標ごとに、平均値、平均値のブートストラップ標準誤差、中央値、標準偏差、四分位範囲、95 パーセンタイル、シャノンの多様性指数、ショット数という 8 つの統計情報が含まれています。GEDI L4B Gridded Aboveground Biomass Density, Version 2.1 に準拠した品質ショット フィルタリング手法が使用されました。対応する GEDI L3 データセットと比較して、このデータセットは複数の空間解像度と複数の時間期間(年単位とミッション全体の期間)で追加のグリッド化された指標を提供します。
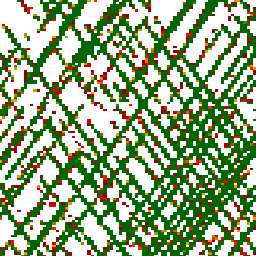
このデータセットは、3 つの空間解像度(1 km、6 km、12 km)でラスター グリッドに集計された GEDI ショット指標を提供します。このデータセットでは、カウント指標で 12 km のピクセルサイズを使用します。
バンド
Pixel Size
12000 メートル
帯域
| 名前 | ピクセルサイズ | 説明 |
|---|---|---|
shots_count |
メートル | ショット数。このレイヤでショットがカウントされるには、経度、緯度、最低モードの標高、10 進数形式の日付、軌道というフィールドが有効である必要があります。 |
orbits_uniq |
メートル | 一意の軌道の数。 |
tracks_uniq |
メートル | ユニークなトラックの数。トラックは、軌道とビームの組み合わせです。 |
shots_nni |
メートル | Nearest Neighbor Index(Evans 他、2023 年)。 |
利用規約
利用規約
このデータセットはパブリック ドメインにあり、使用と配布に制限はありません。詳しくは、NASA の地球科学データと情報に関するポリシーをご覧ください。
引用
Burns, P.、Hakkenberg, C.R. & Goetz, S.J. GEDI による植生構造のマルチ解像度グリッド マップ。Sci Data 11, 881 (2024). doi:10.1038/s41597-024-03668-4
Earth Engine で探索する
コードエディタ(JavaScript)
var palettes = require('users/gena/packages:palettes');


// slopeshade basemap
var elev = ee.Image('MERIT/DEM/v1_0_3').select('dem')
var slope = ee.Terrain.slope(elev)
Map.setCenter(92.319, 27.129, 8)
Map.addLayer(
    slope, {min: 0, max: 40, palette: ['ffffff', '000000']}, 'Slopeshade')

var opac = 0.7
// View various measurement count metrics from 2019 to 2023
// "va" in the asset name corresponds to the count of high-quality, leaf-on
// vegetation measurements by GEDI
var i_counts_12k_19to23 = ee.Image(
    'LARSE/GEDI/GRIDDEDVEG_002/COUNTS/V1/12KM/gediv002_counts_va_20190417_20230316')
// Number of GEDI laser shots (i.e. footprints) per 12km pixel
Map.addLayer(
    i_counts_12k_19to23.select('shots_count'),
    {min: 0, max: 200, palette: palettes.matplotlib.magma[7]},
    'Shot count per 12km pixel, 2019 to 2023', 0, opac)
// Number of ISS orbits (with valid GEDI shots) per 12km pixel
Map.addLayer(
    i_counts_12k_19to23.select('orbits_uniq'),
    {min: 0, max: 10, palette: palettes.matplotlib.plasma[7]},
    'Unique orbits per 12km pixel, 2019 to 2023', 0, opac)
// The Nearest Neighbor Index (Evans et al. 2023), a proxy for quantifying
// spatial clustering/dispersion of GEDI shots
Map.addLayer(
    i_counts_12k_19to23.select('shots_nni'),
    {min: 0.5, max: 1.5, palette: palettes.colorbrewer.RdBu[7]},
    'Shot nearest neighbor index per 12km pixel, 2019 to 2023', 0, opac)

// View several GEDI vegetation structure metrics at 12km spatial res.
// For GEDI metric descriptions see Table 1 at
// https://daac.ornl.gov/GEDI/guides/GEDI_HighQuality_Shots_Rasters.html
// Relative height of the 98th percentile of returned energy (RH98), a proxy for
// tree canopy height
var i_rh98_12k_19to23 = ee.Image(
    'LARSE/GEDI/GRIDDEDVEG_002/V1/12KM/gediv002_rh-98-a0_vf_20190417_20230316')
// display the median value of GEDI RH98 measurements per 6km pixel, masking out
// values less than 3 consider using a threshold of 10 shots per 12km pixel.
// More shots generally yield more accurate estimates of the aggregation
// statistics (different bands)
var i_rh98_12k_19to23_med = i_rh98_12k_19to23.select('median')
var rh98_pal = palettes.crameri.bamako[10].reverse()
Map.addLayer(
    i_rh98_12k_19to23_med.updateMask(i_rh98_12k_19to23_med.gte(3).and(
        i_rh98_12k_19to23.select('countf').gte(10))),
    {min: 3, max: 40, palette: rh98_pal},
    'Median RH98 per 12km pixel, 2019 to 2023', 1, opac)
// Standard deviation of RH98 per 12km pixel. Captures variability of GEDI
// measurements and vegetation heterogeneity
Map.addLayer(
    i_rh98_12k_19to23.select('sd').updateMask(i_rh98_12k_19to23_med.gte(3).and(
        i_rh98_12k_19to23.select('countf').gte(10))),
    {min: 2, max: 20, palette: palettes.cmocean.Curl[7]},
    'SD of RH98 per 12km pixel, 2019 to 2023', 0, opac)
// Foliage height diversity of the 1m vertical Plant Area Index (PAI) profile
var i_fhd_12k_19to23 = ee.Image(
    'LARSE/GEDI/GRIDDEDVEG_002/V1/12KM/gediv002_fhd-pai-1m-a0_vf_20190417_20230316')
Map.addLayer(
    i_fhd_12k_19to23.select('median').updateMask(
        i_rh98_12k_19to23_med.gte(3).and(
            i_rh98_12k_19to23.select('countf').gte(10))),
    {min: 1.2, max: 3.2, palette: palettes.matplotlib.viridis[7].reverse()},
    'Median FHD per 12km pixel, 2019 to 2023', 0, opac)
// The height above ground associated with the peak of the vertical Plant Area
// Volume Density (PAVD) profile
var i_pavdmaxh_19to23 = ee.Image(
    'LARSE/GEDI/GRIDDEDVEG_002/V1/12KM/gediv002_pavd-max-h_vf_20190417_20230316')
Map.addLayer(
    i_pavdmaxh_19to23.select('mean').updateMask(
        i_rh98_12k_19to23_med.gte(3).and(
            i_pavdmaxh_19to23.select('countf').gte(10))),
    {min: 0, max: 25, palette: palettes.cmocean.Haline[7].reverse()},
    'Mean Height of Max. PAVD, 2019 to 2023', 0, opac)

// 1km coverage is not great in the low latitudes, try 6 or 12km for a more
// continuous depiction
var i_rh98_6k_19to23 = ee.Image(
    'LARSE/GEDI/GRIDDEDVEG_002/V1/6KM/gediv002_rh-98-a0_vf_20190417_20230316')
// display the median value of GEDI RH98 measurements per 6km pixel, masking out
// values less than 3 consider using a threshold of 100 shots per 6km pixel.
// More shots generally yield more accurate estimates of the aggregation
// statistics (different bands)
var i_rh98_6k_19to23_med = i_rh98_6k_19to23.select('median')
Map.addLayer(
    i_rh98_6k_19to23_med.updateMask(i_rh98_6k_19to23_med.gte(3).and(
        i_rh98_6k_19to23.select('countf').gte(100))),
    {min: 3, max: 40, palette: rh98_pal},
    'Median RH98 per 6km pixel, 2019 to 2023', 0, opac)
