Ежедневные и ежемесячные наборы данных PRISM представляют собой сетки климатических данных для территории США, созданные климатической группой PRISM в Университете штата Орегон.
Сетки разрабатываются с использованием PRISM (модель регрессии параметров и высоты на независимых уклонах). Интерполяционные процедуры PRISM моделируют изменение погоды и климата с высотой над уровнем моря, а также учитывают влияние прибрежной зоны, температурные инверсии и рельефа местности, которые могут вызывать дождевые тени. Данные станций усваиваются из множества сетей по всей стране. Подробнее см. в описании наборов пространственных климатических данных PRISM .
Группы
Размер пикселя 928 метров
Группы
Имя
Единицы
Мин.
Макс
Размер пикселя
Описание
ppt
мм
0,03*
1046.09*
метров
30-летнее среднемесячное количество осадков (включая дождь и талую воду)
tmean
°С
-16.15*
37.88*
метров
30-летняя средняя месячная температура (рассчитывается как (tmin+tmax)/2)
tmin
°С
-21,9*
29.79*
метров
30-летняя средняя месячная минимальная температура
tmax
°С
-10,78*
46.63*
метров
30-летняя средняя месячная максимальная температура
tdmean
°С
-19.07*
25.22*
метров
30-летняя средняя месячная температура точки росы
vpdmin
гПа
0*
33.11*
метров
30-летний средний ежемесячный минимальный дефицит давления пара
vpdmax
гПа
0,37*
94.11*
метров
30-летний средний ежемесячный максимальный дефицит давления пара
solclear
МДж м^-2 сут^-1
метров
30-летнее среднемесячное значение глобальной коротковолновой солнечной радиации, полученной на горизонтальной поверхности в условиях ясного неба
solslope
МДж м^-2 сут^-1
метров
30-летнее среднемесячное глобальное коротковолновое солнечное излучение, полученное на наклонной поверхности
30-летнее среднее значение атмосферной прозрачности (облачности)
* расчетное минимальное или максимальное значение
Свойства изображения
Имя
Тип
Описание
PRISM_DATASET_CREATE_DATE
STRING_LIST
Список исходных дат создания для каждой полосы, например: первый элемент — для первой полосы «ppt», второй элемент — для второй полосы «tmean».
PRISM_DATASET_TYPE
STRING_LIST
Список типов наборов данных для каждого диапазона
PRISM_CODE_VERSION
STRING_LIST
Список версий кода для каждого диапазона
PRISM_DATASET_FILENAME
STRING_LIST
Список оригинальных имен файлов для каждой группы
Условия эксплуатации
Эти наборы данных PRISM доступны без ограничений на использование или распространение. Климатическая группа PRISM просит пользователей указывать авторство и, где это применимо, указывать PRISM как источник данных. https://prism.oregonstate.edu/terms/
Цитаты
Цитаты:
Дейли, К., Халблейб, М., Смит, Дж.И., Гибсон, У.П., Доггетт, М.К., Тейлор, Г.Х., Кёртис, Дж. и Пастерис, П.А. 2008. Физиографически чувствительное картирование температуры и осадков на всей территории США. Международный журнал климатологии, 28: 2031–2064 , doi:10.1002/joc.1688,pdf .
[Дейли, К., Дж. И. Смит и К. В. Олсон. 2015. Картографирование климатологии атмосферной влажности на всей территории США. PloS ONE 10(10):e0141140. doi:10.1371/journal.pone.0141140 .
Ежедневные и ежемесячные наборы данных PRISM представляют собой сетку климатических данных для всей территории США, разработанную климатической группой PRISM в Университете штата Орегон. Сетки разработаны с использованием модели PRISM (Parameter-Elevation Regressions on Independent Slopes Model). Интерполяционные процедуры PRISM имитируют изменение погоды и климата с высотой и учитывают…
[null,null,[],[[["\u003cp\u003eThe PRISM Norm91m dataset provides 30-year average monthly climate data for the conterminous United States, including precipitation, temperature, and solar radiation.\u003c/p\u003e\n"],["\u003cp\u003eDeveloped by the PRISM Climate Group at Oregon State University, it utilizes the PRISM interpolation method which accounts for terrain and coastal effects for higher accuracy.\u003c/p\u003e\n"],["\u003cp\u003eThe dataset has a spatial resolution of 928 meters and covers the period from 1991 to 2020.\u003c/p\u003e\n"],["\u003cp\u003eIt is freely available for use with proper attribution to PRISM.\u003c/p\u003e\n"],["\u003cp\u003eYou can access and analyze this dataset using Google Earth Engine.\u003c/p\u003e\n"]]],["The PRISM Climate Group at Oregon State University provides gridded climate datasets for the contiguous U.S. from 1991 to 2020, available via the Earth Engine platform. These datasets, generated using the PRISM model, include 30-year averages of monthly precipitation, temperature (mean, min, max), dew point, vapor pressure deficit, and solar radiation metrics at 928-meter pixel resolution. Data can be accessed with code snippet provided, and used with proper attribution.\n"],null,["# PRISM Long-Term Average Climate Dataset Norm91m\n\nDataset Availability\n: 1991-01-01T00:00:00Z--2020-12-31T00:00:00Z\n\nDataset Provider\n:\n\n\n [PRISM / OREGONSTATE](https://www.prism.oregonstate.edu/)\n\nClimatological Interval\n: 1 Month\n\nTags\n:\n [climate](/earth-engine/datasets/tags/climate) [geophysical](/earth-engine/datasets/tags/geophysical) [oregonstate](/earth-engine/datasets/tags/oregonstate) [precipitation](/earth-engine/datasets/tags/precipitation) [pressure](/earth-engine/datasets/tags/pressure) [prism](/earth-engine/datasets/tags/prism) [temperature](/earth-engine/datasets/tags/temperature) [vapor](/earth-engine/datasets/tags/vapor) [weather](/earth-engine/datasets/tags/weather) \n30-year \n\n#### Description\n\nThe PRISM daily and monthly datasets are gridded climate\ndatasets for the conterminous United States, produced by the\nPRISM Climate Group at Oregon State University.\n\nGrids are\ndeveloped using PRISM (Parameter-elevation Regressions on Independent\nSlopes Model). PRISM interpolation routines simulate how weather\nand climate vary with elevation, and account for coastal effects,\ntemperature inversions, and terrain barriers that can cause rain\nshadows. Station data are assimilated from many networks across\nthe country. For more information, see the [Descriptions of PRISM\nSpatial Climate Datasets](https://www.prism.oregonstate.edu/documents/PRISM_datasets.pdf).\n\n### Bands\n\n\n**Pixel Size**\n\n928 meters\n\n**Bands**\n\n| Name | Units | Min | Max | Pixel Size | Description |\n|------------|------------------|----------|-----------|------------|-------------------------------------------------------------------------------------------------------------------------|\n| `ppt` | mm | 0.03\\* | 1046.09\\* | meters | 30-year average of monthly total precipitation (including rain and melted snow) |\n| `tmean` | °C | -16.15\\* | 37.88\\* | meters | 30-year average of monthly mean temperature (calculated as (tmin+tmax)/2) |\n| `tmin` | °C | -21.9\\* | 29.79\\* | meters | 30-year average of monthly minimum temperature |\n| `tmax` | °C | -10.78\\* | 46.63\\* | meters | 30-year average of monthly maximum temperature |\n| `tdmean` | °C | -19.07\\* | 25.22\\* | meters | 30-year average of monthly mean dew point temperature |\n| `vpdmin` | hPa | 0\\* | 33.11\\* | meters | 30-year average of monthly minimum vapor pressure deficit |\n| `vpdmax` | hPa | 0.37\\* | 94.11\\* | meters | 30-year average of monthly maximum vapor pressure deficit |\n| `solclear` | MJ m\\^-2 day\\^-1 | | | meters | 30-year average of monthly global shortwave solar radiation received on a horizontal surface under clear sky conditions |\n| `solslope` | MJ m\\^-2 day\\^-1 | | | meters | 30-year average of monthly global shortwave solar radiation received on a sloped surface |\n| `soltotal` | MJ m\\^-2 day\\^-1 | | | meters | 30-year average of monthly global shortwave solar radiation received on a horizontal surface |\n| `soltrans` | Fraction | | | meters | 30-year average of atmospheric transmittance (cloudiness) |\n\n\\* estimated min or max value\n\n### Image Properties\n\n**Image Properties**\n\n| Name | Type | Description |\n|---------------------------|-------------|------------------------------------------------------------------------------------------------------------------------------------------------------|\n| PRISM_DATASET_CREATE_DATE | STRING_LIST | List of original creation dates for each band, e.g: the first element is for the first band \"ppt\", the second element is for the second band \"tmean\" |\n| PRISM_DATASET_TYPE | STRING_LIST | List of dataset types per-band |\n| PRISM_CODE_VERSION | STRING_LIST | List of code versions per-band |\n| PRISM_DATASET_FILENAME | STRING_LIST | List of original filenames per-band |\n\n### Terms of Use\n\n**Terms of Use**\n\nThese PRISM datasets are available without restriction\non use or distribution. PRISM Climate Group does request that the\nuser give proper attribution and identify PRISM, where applicable,\nas the source of the data.\n\u003chttps://prism.oregonstate.edu/terms/\u003e\n\n### Citations\n\nCitations:\n\n- Daly, C., Halbleib, M., Smith, J.I., Gibson, W.P., Doggett, M.K.,\n Taylor, G.H., Curtis, J., and Pasteris, P.A. 2008. Physiographically-sensitive\n mapping of temperature and precipitation across the conterminous\n United States. International Journal of Climatology, 28: 2031-2064\n [doi:10.1002/joc.1688](https://doi.org/10.1002/joc.1688)\n [pdf](https://www.prism.oregonstate.edu/documents/pubs/2008intjclim_physiographicMapping_daly.pdf).\n- \\[Daly, C., J.I. Smith, and K.V. Olson. 2015. Mapping atmospheric\n moisture climatologies across the conterminous United States. PloS\n ONE 10(10):e0141140.\n [doi:10.1371/journal.pone.0141140](https://doi.org/10.1371/journal.pone.0141140).\n\n### DOIs\n\n- \u003chttps://doi.org/10.1371/journal.pone.0141140\u003e\n\n### Explore with Earth Engine\n\n| **Important:** Earth Engine is a platform for petabyte-scale scientific analysis and visualization of geospatial datasets, both for public benefit and for business and government users. Earth Engine is free to use for research, education, and nonprofit use. To get started, please [register for Earth Engine access.](https://console.cloud.google.com/earth-engine)\n\n### Code Editor (JavaScript)\n\n```javascript\n
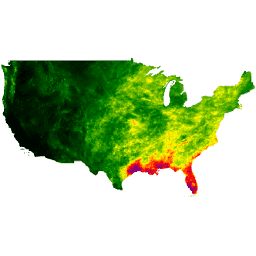
var dataset = ee.ImageCollection('OREGONSTATE/PRISM/Norm91m');\nvar precipitation = dataset.select('ppt');\nvar precipitationVis = {\n min: 0.0,\n max: 300.0,\n palette: ['red', 'yellow', 'green', 'cyan', 'purple'],\n};\nMap.setCenter(-100.55, 40.71, 0);\nMap.addLayer(precipitation, precipitationVis, 'Precipitation');\n```\n[Open in Code Editor](https://code.earthengine.google.com/?scriptPath=Examples:Datasets/OREGONSTATE/OREGONSTATE_PRISM_Norm91m) \n[PRISM Long-Term Average Climate Dataset Norm91m](/earth-engine/datasets/catalog/OREGONSTATE_PRISM_Norm91m) \nThe PRISM daily and monthly datasets are gridded climate datasets for the conterminous United States, produced by the PRISM Climate Group at Oregon State University. Grids are developed using PRISM (Parameter-elevation Regressions on Independent Slopes Model). PRISM interpolation routines simulate how weather and climate vary with elevation, and account for ... \nOREGONSTATE/PRISM/Norm91m, climate,geophysical,oregonstate,precipitation,pressure,prism,temperature,vapor,weather \n1991-01-01T00:00:00Z/2020-12-31T00:00:00Z \n24 -125 50 -66 \nGoogle Earth Engine \nhttps://developers.google.com/earth-engine/datasets\n\n- [https://doi.org/10.1371/journal.pone.0141140](https://doi.org/https://www.prism.oregonstate.edu/)\n- [https://doi.org/10.1371/journal.pone.0141140](https://doi.org/https://developers.google.com/earth-engine/datasets/catalog/OREGONSTATE_PRISM_Norm91m)"]]