Page Summary
-
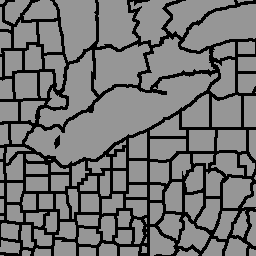
The dataset provides political administrative boundaries at the municipality level (ADM2) for 199 entities globally.
-
This dataset is part of the Comprehensive Global Administrative Zones (CGAZ), which provides global composites for administrative boundaries at ADM0, ADM1, and ADM2 levels.
-
The data was ingested from version 6.0.0 of the Global Composite Files, updated on 2023-09-13.
-
The dataset includes a table schema with details on shapeGroup, shapeName, shapeType, and shapeID.
-
The geoBoundaries datasets are available under the CC BY 4.0 license, allowing for various uses.
- Dataset Availability
- 2023-09-14T00:00:00Z–2023-09-14T00:00:00Z
- Dataset Producer
- William and Mary geoLab
- Tags
Description
The geoBoundaries Global Database of Political Administrative Boundaries Database is an online, open license resource of boundaries (i.e., state, county) for every country in the world. Currently 199 total entities are tracked, including all 195 UN member states, Greenland, Taiwan, Niue, and Kosovo.
Comprehensive Global Administrative Zones (CGAZ) is a set of global composites for administrative boundaries. Disputed areas are removed and replaced with polygons following US Department of State definitions. It has three boundary levels ADM0, ADM1, and ADM2, clipped to international boundaries (US Department of State), with gaps filled between borders.
This dataset is part of CGAZ. It was ingested from version 6.0.0 of Global Composite Files with DBF_DATE_LAST_UPDATE=2023-09-13. It shows boundaries at level ADM2 (municipality-level boundaries).
Table Schema
Table Schema
| Name | Type | Description |
|---|---|---|
| shapeGroup | STRING | Unique country code |
| shapeName | STRING | Administrative region name |
| shapeType | STRING | Boundary type:
|
| shapeID | DOUBLE | Unique ID assigned to the shape |
Terms of Use
Terms of Use
geoBoundaries datasets are provided under the CC BY 4.0 license, which allows for most commmercial, noncommercial, and academic uses. See provider terms of use.
Explore with Earth Engine
Code Editor (JavaScript)
var dataset = ee.FeatureCollection('WM/geoLab/geoBoundaries/600/ADM2');

Map.setCenter(-100.0, 38.5, 4);

var styleParams = {
  fillColor: 'b5ffb4',
  color: '00909F',
  width: 1.0,
};

dataset = dataset.style(styleParams);

Map.addLayer(dataset, {}, 'ADM2 Boundaries');