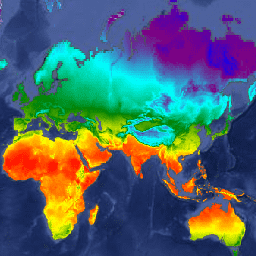
WorldClim V1 Bioclim предоставляет биоклиматические переменные, которые выводятся на основе месячной температуры и количества осадков для получения более биологически значимых значений.
Биоклиматические переменные отражают годовые тенденции (например, среднегодовая температура, годовое количество осадков), сезонность (например, годовой диапазон температур и осадков) и экстремальные или ограничивающие факторы окружающей среды (например, температура самого холодного и самого теплого месяца и осадки влажных и сухих кварталов).
Схема полос соответствует схеме ANUCLIM, за исключением того, что для сезонности температуры использовалось стандартное отклонение, поскольку коэффициент вариации не имеет смысла при температурах от -1 до 1.
WorldClim версии 1 был разработан Робертом Дж. Хиджмансом, Сьюзен Кэмерон и Хуаном Паррой из Музея зоологии позвоночных Калифорнийского университета в Беркли в сотрудничестве с Питером Джонсом и Эндрю Джарвисом (CIAT), а также с Карен Ричардсон (Rainforest CRC).
Группы
Размер пикселя 927,67 метра
Группы
Имя
Единицы
Мин.
Макс
Шкала
Размер пикселя
Описание
bio01
°С
-29*
32*
0.1
метров
Среднегодовая температура
bio02
°С
0,9*
21.4*
0.1
метров
Средний суточный диапазон (средний месячный (макс. температура - мин. температура))
bio03
%
7*
96*
метров
Изотермичность (био02/био07 * 100)
bio04
°С
0,62*
227.21*
0,01
метров
Сезонность температуры (стандартное отклонение * 100)
Хиджманс, Р. Дж., С. Э. Кэмерон, Дж. Л. Парра, П. Г. Джонс и А. Джарвис, 2005. Интерполированные климатические поверхности с очень высоким разрешением для территорий суши мира. Международный журнал климатологии 25: 1965-1978. doi:10.1002/joc.1276 .
WorldClim V1 Bioclim предоставляет биоклиматические переменные, вычисляемые на основе месячных данных о температуре и количестве осадков, для получения более биологически значимых значений. Биоклиматические переменные отражают годовые тенденции (например, среднегодовую температуру, количество осадков), сезонность (например, годовой диапазон температур и осадков) и экстремальные или ограничивающие факторы окружающей среды (например,…
WORLDCLIM/V1/BIO, Беркли, климат, по месяцам, осадки, температура, погода, мировой климат
[null,null,[],[[["\u003cp\u003eWorldClim V1 Bioclim provides 19 bioclimatic variables derived from monthly temperature and rainfall to represent annual trends, seasonality, and extreme environmental factors.\u003c/p\u003e\n"],["\u003cp\u003eThe dataset covers the period from 1960 to 1991 with a spatial resolution of 927.67 meters.\u003c/p\u003e\n"],["\u003cp\u003eIt includes variables such as annual mean temperature, temperature seasonality, annual precipitation, and precipitation of wettest/driest quarters.\u003c/p\u003e\n"],["\u003cp\u003eDeveloped by researchers at the University of California, Berkeley, in collaboration with CIAT and Rainforest CRC.\u003c/p\u003e\n"],["\u003cp\u003eThis dataset is available under the CC-BY-SA-4.0 license.\u003c/p\u003e\n"]]],[],null,["# WorldClim BIO Variables V1\n\nDataset Availability\n: 1960-01-01T00:00:00Z--1991-01-01T00:00:00Z\n\nDataset Provider\n:\n\n\n [University of California, Berkeley](https://www.worldclim.org/)\n\nTags\n:\n [berkeley](/earth-engine/datasets/tags/berkeley) [climate](/earth-engine/datasets/tags/climate) [monthly](/earth-engine/datasets/tags/monthly) [precipitation](/earth-engine/datasets/tags/precipitation) [temperature](/earth-engine/datasets/tags/temperature) [weather](/earth-engine/datasets/tags/weather) [worldclim](/earth-engine/datasets/tags/worldclim) \n bioclim \n coldest \n diurnal \n driest \n isothermality \n seasonality \n warmest \nwettest \n\n#### Description\n\nWorldClim V1 Bioclim provides bioclimatic variables that are derived from\nthe monthly temperature and rainfall in order to generate more biologically\nmeaningful values.\n\nThe bioclimatic variables represent annual trends (e.g., mean annual\ntemperature, annual precipitation), seasonality (e.g., annual range in\ntemperature and precipitation), and extreme or limiting environmental\nfactors (e.g., temperature of the coldest and warmest month, and\nprecipitation of the wet and dry quarters).\n\nThe bands scheme follows that of ANUCLIM, except that for temperature\nseasonality the standard deviation was used because a coefficient of\nvariation does not make sense with temperatures between -1 and 1.\n\nWorldClim version 1 was developed by Robert J. Hijmans, Susan Cameron,\nand Juan Parra, at the Museum of Vertebrate Zoology, University of\nCalifornia, Berkeley, in collaboration with Peter Jones and Andrew Jarvis\n(CIAT), and with Karen Richardson (Rainforest CRC).\n\n### Bands\n\n\n**Pixel Size**\n\n927.67 meters\n\n**Bands**\n\n| Name | Units | Min | Max | Scale | Pixel Size | Description |\n|---------|--------------------------|---------|----------|-------|------------|------------------------------------------------------------|\n| `bio01` | °C | -29\\* | 32\\* | 0.1 | meters | Annual mean temperature |\n| `bio02` | °C | 0.9\\* | 21.4\\* | 0.1 | meters | Mean diurnal range (mean of monthly (max temp - min temp)) |\n| `bio03` | % | 7\\* | 96\\* | | meters | Isothermality (bio02/bio07 \\* 100) |\n| `bio04` | °C | 0.62\\* | 227.21\\* | 0.01 | meters | Temperature seasonality (Standard deviation \\* 100) |\n| `bio05` | °C | -9.6\\* | 49\\* | 0.1 | meters | Max temperature of warmest month |\n| `bio06` | °C | -57.3\\* | 25.8\\* | 0.1 | meters | Min temperature of coldest month |\n| `bio07` | °C | 5.3\\* | 72.5\\* | 0.1 | meters | Temperature annual range (bio05-bio06) |\n| `bio08` | °C | -28.5\\* | 37.8\\* | 0.1 | meters | Mean temperature of wettest quarter |\n| `bio09` | °C | -52.1\\* | 36.6\\* | 0.1 | meters | Mean temperature of driest quarter |\n| `bio10` | °C | -14.3\\* | 38.3\\* | 0.1 | meters | Mean temperature of warmest quarter |\n| `bio11` | °C | -52.1\\* | 28.9\\* | 0.1 | meters | Mean temperature of coldest quarter |\n| `bio12` | mm | 0\\* | 11401\\* | | meters | Annual precipitation |\n| `bio13` | mm | 0\\* | 2949\\* | | meters | Precipitation of wettest month |\n| `bio14` | mm | 0\\* | 752\\* | | meters | Precipitation of driest month |\n| `bio15` | Coefficient of Variation | 0\\* | 265\\* | | meters | Precipitation seasonality |\n| `bio16` | mm | 0\\* | 8019\\* | | meters | Precipitation of wettest quarter |\n| `bio17` | mm | 0\\* | 2495\\* | | meters | Precipitation of driest quarter |\n| `bio18` | mm | 0\\* | 6090\\* | | meters | Precipitation of warmest quarter |\n| `bio19` | mm | 0\\* | 5162\\* | | meters | Precipitation of coldest quarter |\n\n\\* estimated min or max value\n\n### Terms of Use\n\n**Terms of Use**\n\n[CC-BY-SA-4.0](https://spdx.org/licenses/CC-BY-SA-4.0.html)\n\n### Citations\n\nCitations:\n\n- Hijmans, R.J., S.E. Cameron, J.L. Parra, P.G. Jones and A. Jarvis,\n 2005. Very High Resolution Interpolated Climate Surfaces for Global Land\n Areas. International Journal of Climatology 25: 1965-1978.\n [doi:10.1002/joc.1276](https://doi.org/10.1002/joc.1276).\n\n### Explore with Earth Engine\n\n| **Important:** Earth Engine is a platform for petabyte-scale scientific analysis and visualization of geospatial datasets, both for public benefit and for business and government users. Earth Engine is free to use for research, education, and nonprofit use. To get started, please [register for Earth Engine access.](https://console.cloud.google.com/earth-engine)\n\n### Code Editor (JavaScript)\n\n```javascript\nvar dataset = ee.Image('WORLDCLIM/V1/BIO');\nvar annualMeanTemperature = dataset.select('bio01').multiply(0.1);\nvar visParams = {\n min: -23,\n max: 30,\n palette: ['blue', 'purple', 'cyan', 'green', 'yellow', 'red'],\n};\nMap.setCenter(71.7, 52.4, 3);\nMap.addLayer(annualMeanTemperature, visParams, 'Annual Mean Temperature');\n```\n[Open in Code Editor](https://code.earthengine.google.com/?scriptPath=Examples:Datasets/WORLDCLIM/WORLDCLIM_V1_BIO) \n[WorldClim BIO Variables V1](/earth-engine/datasets/catalog/WORLDCLIM_V1_BIO) \nWorldClim V1 Bioclim provides bioclimatic variables that are derived from the monthly temperature and rainfall in order to generate more biologically meaningful values. The bioclimatic variables represent annual trends (e.g., mean annual temperature, annual precipitation), seasonality (e.g., annual range in temperature and precipitation), and extreme or limiting environmental factors (e.g., ... \nWORLDCLIM/V1/BIO, berkeley,climate,monthly,precipitation,temperature,weather,worldclim \n1960-01-01T00:00:00Z/1991-01-01T00:00:00Z \n-90 -180 90 180 \nGoogle Earth Engine \nhttps://developers.google.com/earth-engine/datasets\n\n- [](https://doi.org/https://www.worldclim.org/)\n- [](https://doi.org/https://developers.google.com/earth-engine/datasets/catalog/WORLDCLIM_V1_BIO)"]]