نظرة عامة
تنظيم صفحاتك في مجموعات
يمكنك حفظ المحتوى وتصنيفه حسب إعداداتك المفضّلة.
اختيار النظام الأساسي:
Android
iOS
JavaScript
تتيح لك ميزة "تنسيق مستند إلى البيانات" لمجموعات البيانات تحميل مجموعات البيانات الجغرافية المكانية الخاصة بك، وتطبيق تنسيق مخصّص على عناصر البيانات فيها، وعرض عناصر البيانات هذه على الخرائط. باستخدام ميزة "تحديد الأنماط المستند إلى البيانات" لمجموعات البيانات، يمكنك إنشاء تصوّرات للبيانات استنادًا إلى أشكال هندسية على شكل نقاط وخطوط متعددة ومضلّعات، وجعل ميزات البيانات تستجيب لأحداث النقر. تتوفّر ميزة "تنسيق مستند إلى البيانات" لمجموعات البيانات على الخرائط المتّجهة فقط (يجب توفير معرّف خريطة).
بدء استخدام ميزة "تنسيق مستند إلى البيانات" لمجموعات البيانات
إضافة مجموعات بيانات جغرافية مكانية مخصّصة
أضِف بياناتك المخصّصة باستخدام Google Cloud Console أو Google Cloud Shell. تحتوي كل مجموعة بيانات على معرّف فريد يمكنك ربطه بنمط خريطة.
تتوفّر تنسيقات البيانات التالية:
- GeoJSON
- قيم مفصولة بفواصل (CSV)
- KML
للحصول على تفاصيل حول متطلبات مجموعات البيانات وقيودها، يُرجى الاطّلاع على
إنشاء مجموعة بيانات وإدارتها.
لمحة عن مجموعات البيانات المتاحة للجميع
لتصميم مجموعة بيانات، يجب ربط نمط خريطة برقم تعريف خريطة، ما يؤدي أيضًا إلى ربط مجموعة البيانات برقم تعريف الخريطة. في أحد التطبيقات، يمكن للمطوّرين الرجوع إلى معرّف الخريطة هذا، وأي نمط خريطة وبيانات جغرافية مكانية مرتبطة به. ولا يتم تطبيق أي عناصر تحكّم إضافية في الوصول إلى البيانات الجغرافية المكانية، ما يجعلها متاحة بشكل فعّال للجميع من خلال التطبيق.
ميزات بيانات الأنماط
بعد تحميل بياناتك المخصّصة وربطها بنمط خريطة ومعرّف خريطة، يمكنك تصميم عناصر البيانات لتحقيق تأثير مرئي، وجعل العناصر تستجيب لأحداث النقر.
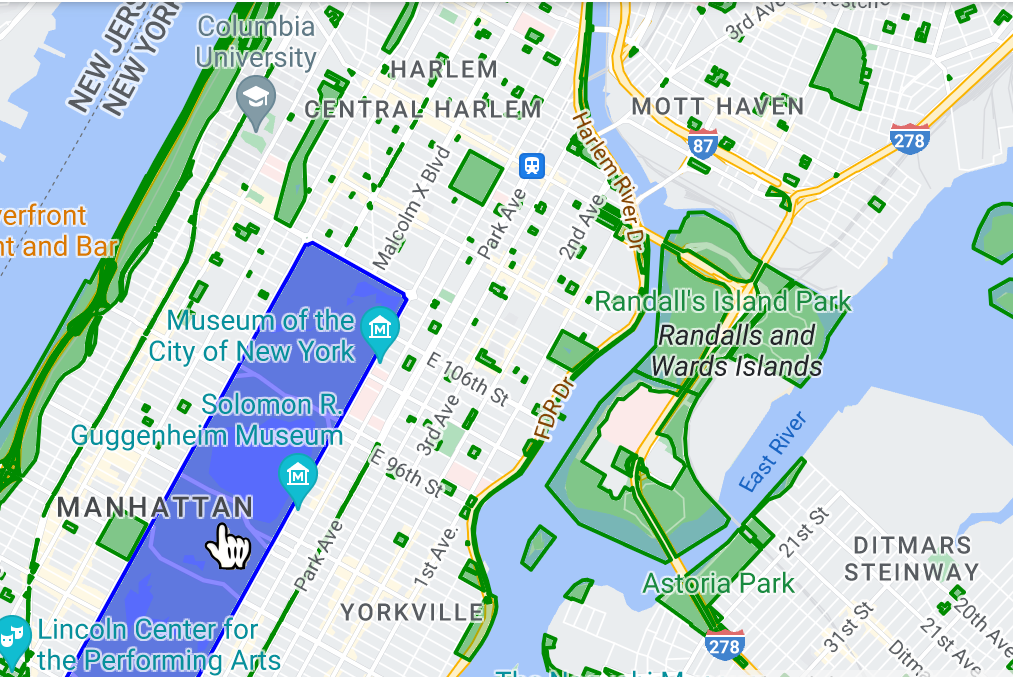
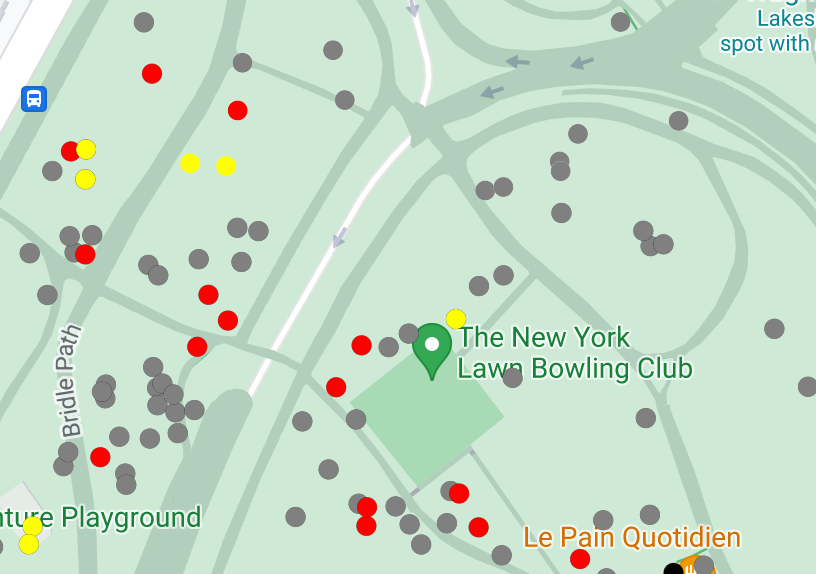
يمكنك تصميم بيانات النقاط لعرض مواقع جغرافية محدّدة على الخريطة.
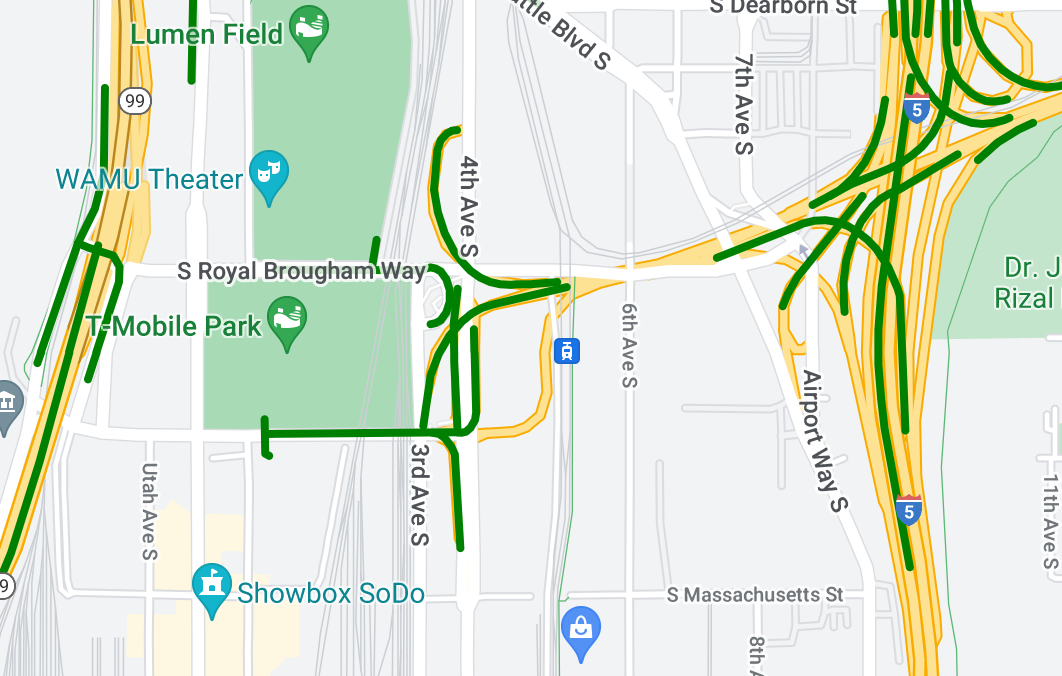
يمكنك تصميم بيانات الخطوط المتعددة لتسليط الضوء على الخصائص الجغرافية.
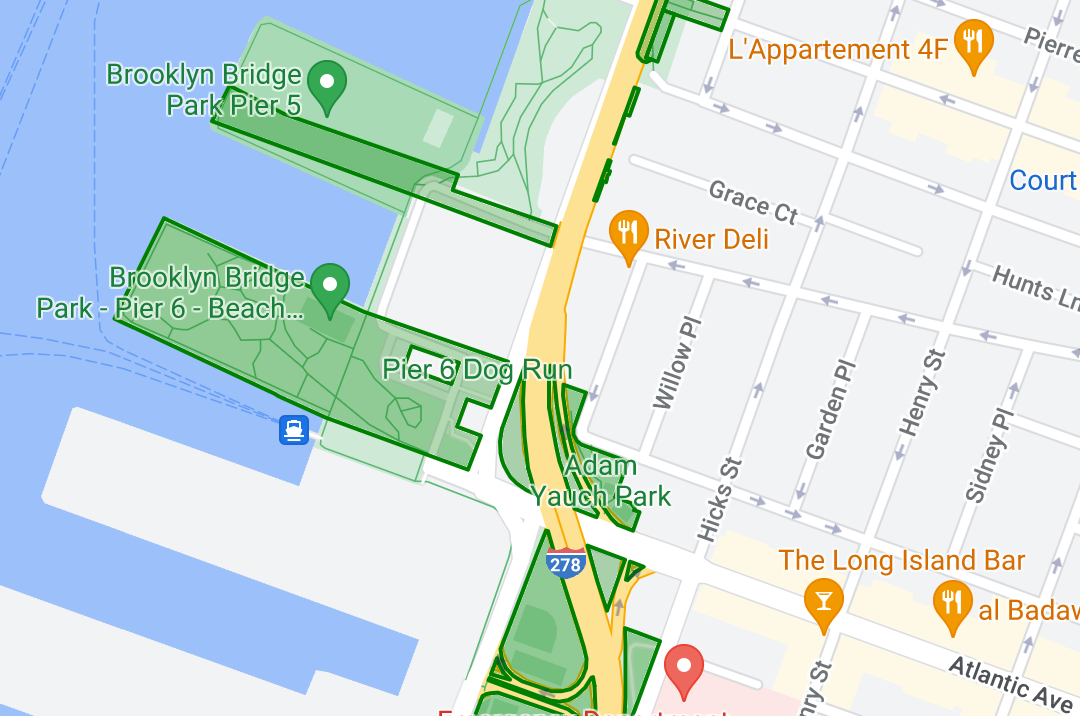
تنسيق بيانات المضلّعات لإبراز المناطق الجغرافية
اجعل ميزات البيانات تستجيب لأحداث النقر من خلال إضافة أداة معالجة الأحداث.
إنّ محتوى هذه الصفحة مرخّص بموجب ترخيص Creative Commons Attribution 4.0 ما لم يُنصّ على خلاف ذلك، ونماذج الرموز مرخّصة بموجب ترخيص Apache 2.0. للاطّلاع على التفاصيل، يُرجى مراجعة سياسات موقع Google Developers. إنّ Java هي علامة تجارية مسجَّلة لشركة Oracle و/أو شركائها التابعين.
تاريخ التعديل الأخير: 2025-08-31 (حسب التوقيت العالمي المتفَّق عليه)
[null,null,["تاريخ التعديل الأخير: 2025-08-31 (حسب التوقيت العالمي المتفَّق عليه)"],[[["\u003cp\u003eData-driven styling allows you to upload custom geospatial datasets (GeoJSON, CSV, KML) and visualize them on vector maps with custom styles based on their geometries.\u003c/p\u003e\n"],["\u003cp\u003eYou can apply unique styling to point, polyline, and polygon data, enabling visualization of locations, geographical features, and areas, respectively.\u003c/p\u003e\n"],["\u003cp\u003eDatasets associated with map IDs are effectively public, accessible to anyone with the app referencing that ID.\u003c/p\u003e\n"],["\u003cp\u003eData features can be made interactive by adding event listeners, allowing them to respond to user interactions like taps.\u003c/p\u003e\n"],["\u003cp\u003eTo get started, you'll need to upload your data using Google Cloud Console or Google Cloud Shell and then associate it with a map style and ID.\u003c/p\u003e\n"]]],[],null,["Select platform: [Android](/maps/documentation/android-sdk/dds-datasets/overview \"View this page for the Android platform docs.\") [iOS](/maps/documentation/ios-sdk/dds-datasets/overview \"View this page for the iOS platform docs.\") [JavaScript](/maps/documentation/javascript/dds-datasets/overview \"View this page for the JavaScript platform docs.\")\n\n\u003cbr /\u003e\n\nData-driven styling for datasets lets you upload your own geospatial datasets,\napply custom styling to their data features, and display those data features on\nmaps. With data-driven styling for datasets, you can create data visualizations\nbased on point, polyline, and polygon geometries, and make data features respond\nto tap events. Data-driven styling for datasets is supported on vector maps\nonly (a map ID is required).\n\n[Get started with data-driven styling for datasets](/maps/documentation/ios-sdk/dds-datasets/start)\n\nAdd custom geospatial datasets\n\nAdd your custom data using Google Cloud Console or Google Cloud\nShell. Each dataset has a unique ID, which you can associate with a map style.\nThe following data formats are supported:\n\n- GeoJSON\n- Comma-separated (CSV)\n- KML\n\nFor details about dataset requirements and limitations, see\n[Create and manage a dataset](/maps/documentation/ios-sdk/dds-datasets/create-dataset#dataset-prerequisites)\n\nAbout public datasets\n\nIn order to style a dataset you must associate a map style with a map ID, which\nalso associates the dataset to the map ID. In an app, developers can reference\nthat map ID, and any map style and geospatial data associated with it. No\nadditional access control is applied to the geospatial data, making the\ngeospatial data effectively publicly available to anyone with the app.\n\nStyle data features\n\nOnce your custom data has been uploaded and associated to a map\nstyle and map ID, you can style data features for visual impact, and make\nfeatures respond to tap events.\n\nStyle point data to show specific locations on the map.\n\nStyle polyline data to highlight geographical features.\n\nStyle polygon data to highlight geographical areas.\n\nMake data features respond to tap events by adding an event\nlistener."]]