使用資料集資料導向樣式,即可上傳自己的地理空間資料集、為資料地圖項目套用自訂樣式,以及在地圖上顯示這些資料地圖項目。此外,您還可藉由點、折線和多邊形幾何圖形,以視覺化的方式呈現資料,並讓資料地圖項目回應輕觸事件。資料集資料導向樣式僅適用於向量地圖 (必須提供地圖 ID)。
新增自訂地理空間資料集
您可以使用 Google Cloud 控制台或 Google Cloud Shell 新增自訂資料。每個資料集都有專屬 ID,可與地圖樣式建立關聯。支援的資料格式如下:
- GeoJSON
- 逗號分隔 (CSV)
- KML
如要進一步瞭解資料集的相關規定和限制,請參閱「建立及管理資料集」一文
關於公開資料集
如要為資料集設定樣式,您必須將地圖樣式與地圖 ID 建立關聯,這也會將資料集與地圖 ID 建立關聯。在應用程式中,開發人員可以參照該地圖 ID,以及與其相關聯的任何地圖樣式和地理空間資料。系統不會對地理空間資料套用額外的存取控管,因此應用程式的使用者都能存取地理空間資料。
設定資料地圖項目樣式
上傳自訂資料並與地圖樣式和地圖 ID 建立關聯後,您就可以設定資料地圖項目的樣式來營造視覺效果,以及讓地圖項目回應輕觸事件。
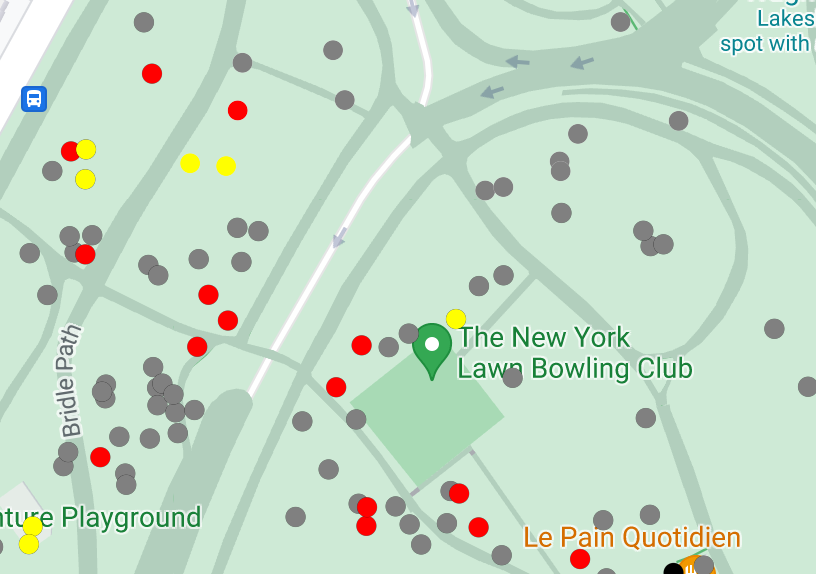
設定點資料的樣式,在地圖上顯示特定位置。
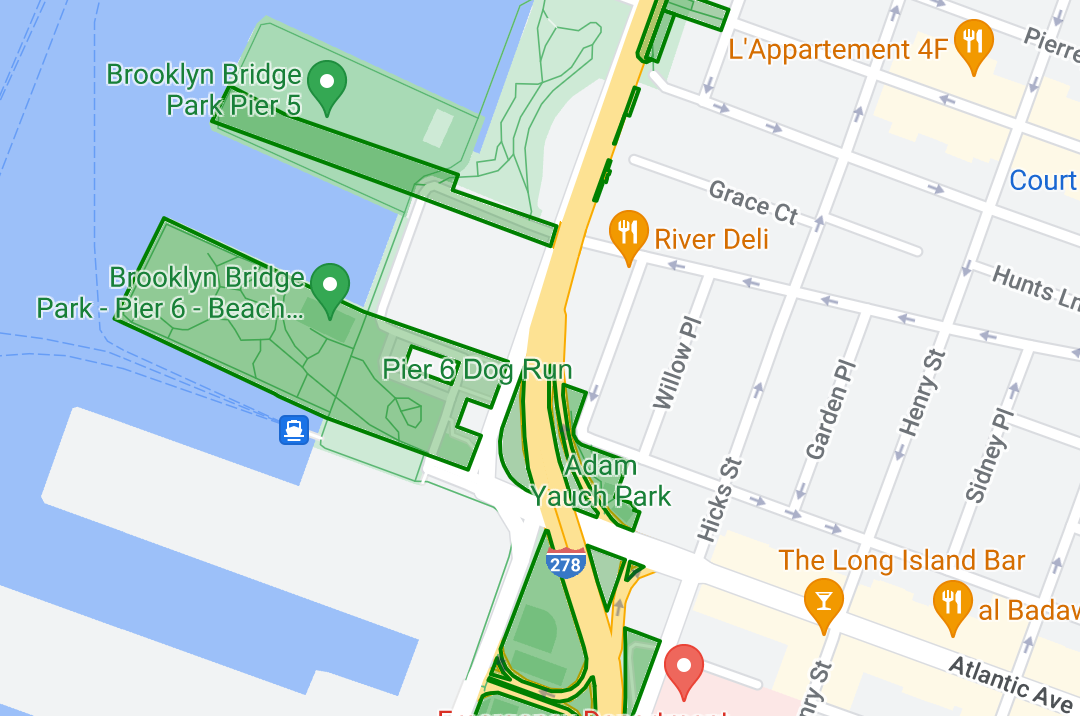
設定折線資料的樣式,凸顯地貌。

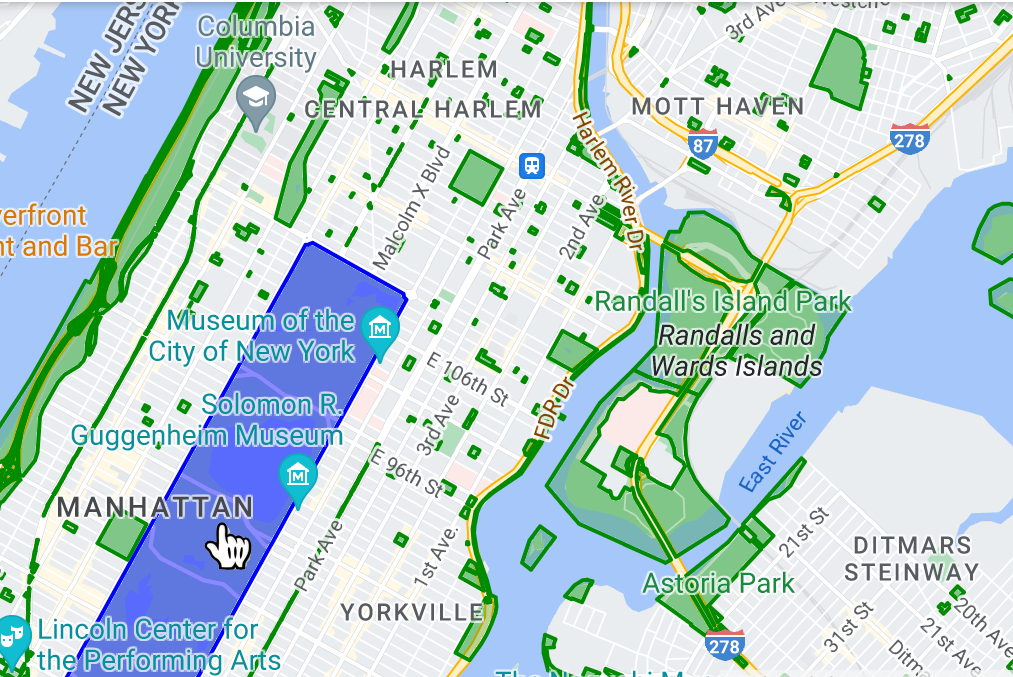
設定多邊形資料的樣式,凸顯地理區域。
新增事件監聽器,讓資料地圖項目回應輕觸事件。