يناقش هذا الفيديو استخدام الخرائط الحرارية كبديل عن العلامات عندما تتطلّب بياناتك عددًا كبيرًا من نقاط البيانات على الخريطة.
تسهّل الخرائط الحرارية على المشاهدين فهم توزيع نقاط البيانات وشدتها النسبية على الخريطة. بدلاً من وضع علامة في كل موقع جغرافي، تستخدم خرائط التمثيل اللوني اللون لتمثيل توزيع البيانات.
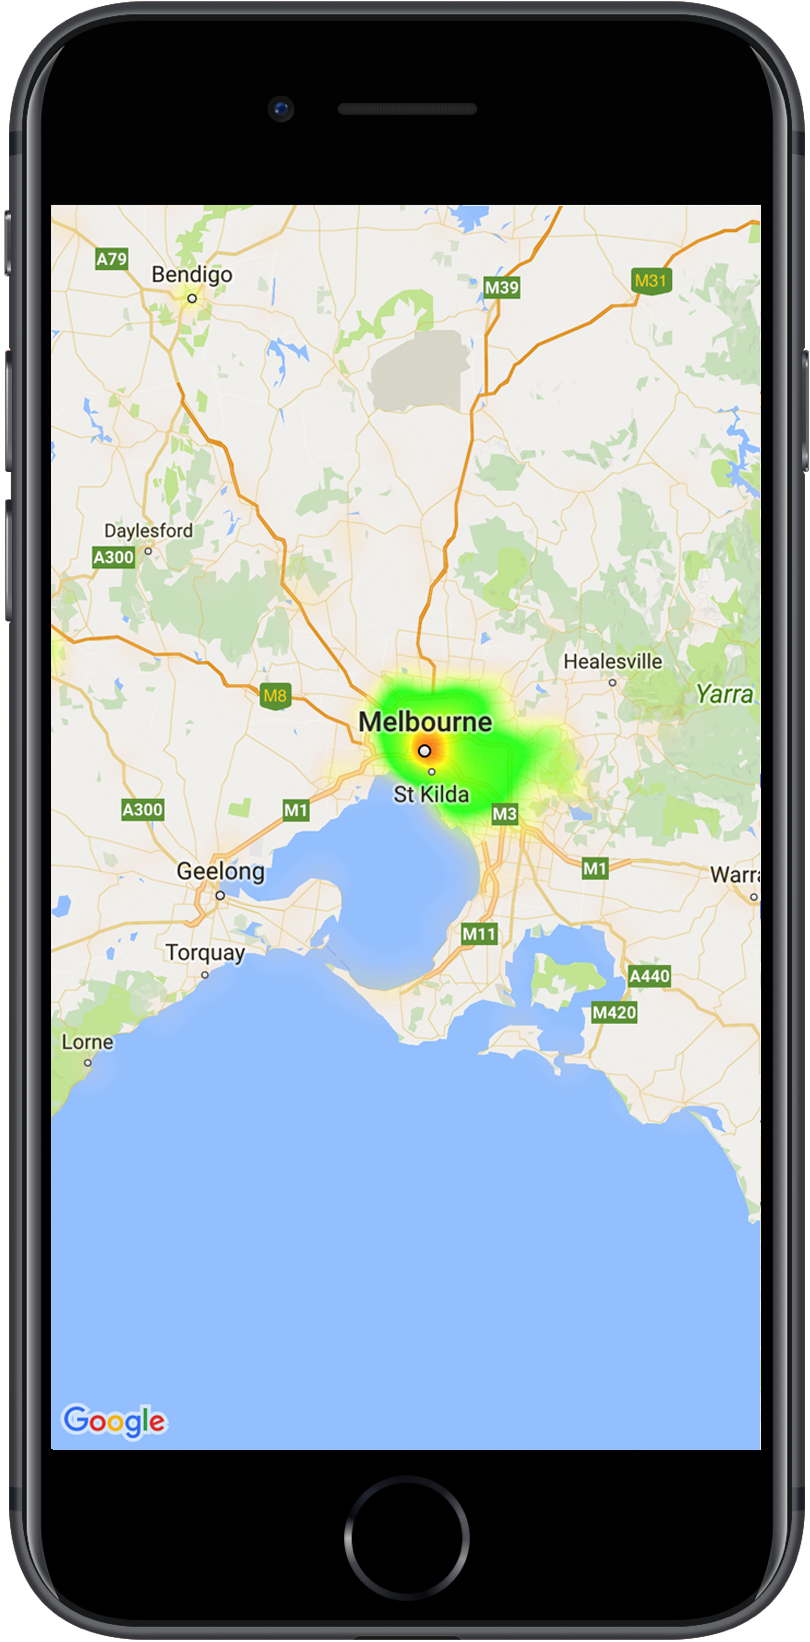
في المثال أدناه، يمثّل اللون الأحمر المناطق التي تتضمّن عددًا كبيرًا من مراكز الشرطة في ولاية فيكتوريا، أستراليا.
خريطة حرارية على خريطة
إذا لم يسبق لك إعداد المكتبة، اتّبِع دليل الإعداد قبل قراءة بقية هذه الصفحة.
إضافة خريطة تمثيل لوني بسيطة
لإضافة خريطة حرارية إلى خريطتك، ستحتاج إلى مجموعة بيانات تتألف من الإحداثيات الخاصة بكل موقع جغرافي يهمّك. أولاً، أنشئ مثيلاً من GMUHeatmapTileLayer، مع ضبط السمة map على GMSMapView.
يمكنك إجراء ذلك في الدالة viewDidLoad() لتطبيقك، وذلك لضمان تحميل الخريطة الأساسية قبل استخدام خريطة الكثافة. بعد ذلك، مرِّر مجموعة من عناصر GMUWeightedLatLng إلى مثيل GMUHeatmapTileLayer.
توفّر الأداة الفئة GMUHeatmapTileLayer التي تقبل مجموعة من عناصر GMUWeightedLatLng. تنشئ هذه الأداة صور المربّعات لمستويات تكبير/تصغير مختلفة، استنادًا إلى خيارات نصف القطر والتدرّج والشفافية التي يتم توفيرها.
في ما يلي نظرة أكثر تفصيلاً على الخطوات:
أنشئ مثيلاً من GMUHeatmapTileLayer، واضبط السمة map على GMSMapView (يمكنك إجراء ذلك في الدالة viewDidLoad() في تطبيقك).
مرِّر مجموعة من عناصر GMUWeightedLatLng إلى مثيل GMUHeatmapTileLayer.
استدعِ الدالة GMUHeatmapTileLayer.map، مع تمرير عرض الخريطة.
Swift
classHeatmap:UIViewController{privatevarmapView:GMSMapView!privatevarheatmapLayer:GMUHeatmapTileLayer!overridefuncviewDidLoad(){super.viewDidLoad()heatmapLayer=GMUHeatmapTileLayer()heatmapLayer.map=mapView}// ...funcaddHeatmap(){// Get the data: latitude/longitude positions of police stations.guardletpath=Bundle.main.url(forResource:"police_stations",withExtension:"json")else{return}guardletdata=try?Data(contentsOf:path)else{return}guardletjson=try?JSONSerialization.jsonObject(with:data,options:[])else{return}guardletobject=jsonas?[[String:Any]]else{print("Could not read the JSON.")return}varlist=[GMUWeightedLatLng]()foriteminobject{letlat=item["lat"]as!CLLocationDegreesletlng=item["lng"]as!CLLocationDegreesletcoords=GMUWeightedLatLng(coordinate:CLLocationCoordinate2DMake(lat,lng),intensity:1.0)list.append(coords)}// Add the latlngs to the heatmap layer.heatmapLayer.weightedData=list}}
Objective-C
@implementationHeatmap{GMSMapView*_mapView;GMUHeatmapTileLayer*_heatmapLayer;}-(void)viewDidLoad{[superviewDidLoad];_heatmapLayer=[[GMUHeatmapTileLayeralloc]init];_heatmapLayer.map=_mapView;}// ...-(void)addHeatmap{// Get the data: latitude/longitude positions of police stations.NSURL*path=[NSBundle.mainBundleURLForResource:@"police_stations"withExtension:@"json"];NSData*data=[NSDatadataWithContentsOfURL:path];NSArray*json=[NSJSONSerializationJSONObjectWithData:dataoptions:0error:nil];NSMutableArray<GMUWeightedLatLng*>*list=[[NSMutableArrayalloc]init];[jsonenumerateObjectsUsingBlock:^(id_Nonnullobj,NSUIntegeridx,BOOL*_Nonnullstop){NSDictionary*item=(NSDictionary*)obj;CLLocationDegreeslat=[(NSNumber*)[itemvalueForKey:@"lat"]doubleValue];CLLocationDegreeslng=[(NSNumber*)[itemvalueForKey:@"lng"]doubleValue];GMUWeightedLatLng*coords=[[GMUWeightedLatLngalloc]initWithCoordinate:CLLocationCoordinate2DMake(lat,lng)intensity:1.0];[listaddObject:coords];}];// Add the latlngs to the heatmap layer._heatmapLayer.weightedData=list;}@end
في هذا المثال، يتم تخزين البيانات في ملف JSON، police_stations.json.
في ما يلي مقتطف من الملف:
تتضمّن خريطة التمثيل الحراري عدة خصائص قابلة للتخصيص. يمكنك ضبط الخيارات عند إنشاء مثيل GMUHeatmapTileLayer في البداية، أو في أي وقت عن طريق ضبط قيمة جديدة للخيار.
تتوفّر الخيارات التالية:
نصف القطر: حجم التمويه الغاوسي الذي يتم تطبيقه على خريطة التمثيل الحراري، ويتم التعبير عنه بالبكسل. القيمة التلقائية هي 20. يجب أن تتراوح القيمة بين 10 و50. استخدِم الرمز GMUHeatmapTileLayer.radius لضبط النطاق الجغرافي.
التدرّج: هو مجموعة من الألوان التي تستخدمها خريطة التمثيل اللوني لإنشاء خريطة الألوان، وتتراوح من أدنى كثافة إلى أعلى كثافة. يتم إنشاء GMUGradient باستخدام مصفوفة أعداد صحيحة تحتوي على الألوان، ومصفوفة أرقام فاصلة عائمة تشير إلى نقطة البداية لكل لون، ويتم عرضها كنسبة مئوية من الحد الأقصى للكثافة، ويتم التعبير عنها ككسر من 0 إلى 1. يجب تحديد لون واحد فقط للتدرّج اللوني الأحادي، أو لونَين على الأقل للتدرّج اللوني المتعدّد. يتم إنشاء خريطة الألوان باستخدام الاستيفاء بين هذه الألوان.
يتضمّن التدرّج اللوني التلقائي لونَين. تحدّد المَعلمة colorMapSize عدد الخطوات في التدرّج. ستؤدي الأرقام الأكبر إلى تدرّج أكثر سلاسة، بينما ستؤدي الأرقام الأصغر إلى انتقالات أكثر حدة تشبه الرسم البياني للمنحنيات. استخدِم GMUHeatmapTileLayer.gradient لضبط التدرّج.
التعتيم: يشير إلى مستوى التعتيم في طبقة خريطة التمثيل اللوني الكاملة، ويتراوح
بين 0 و1. القيمة التلقائية هي 0.7. استخدِم GMUHeatmapTileLayer.opacity لضبط قيمة التعتيم.
لتغيير مستوى عتامة خريطة حرارية حالية، اتّبِع الخطوات التالية:
Swift
heatmapLayer.opacity=0.7
Objective-C
_heatmapLayer.opacity=0.7;
تعديل خيار حالي
لتعديل خيار تم ضبطه من قبل، اتّبِع الخطوات التالية:
عدِّل الخيار إلى القيمة المطلوبة.
تواصل هاتفيًا مع "GMUHeatmapTileLayer.clearTileCache()".
تغيير مجموعة البيانات
لتغيير مجموعة البيانات التي يتم إنشاء خريطة حرارية استنادًا إليها، اتّبِع الخطوات التالية:
تعديل عملية جمع البيانات استخدِم GMUHeatmapTileLayer.weightedData، مع تمرير صفيف من GMUWeightedLatLng.
تواصل هاتفيًا مع "GMUHeatmapTileLayer.clearTileCache()".
إزالة خريطة التمثيل اللوني
لإزالة خريطة الكثافة، استدعِ الدالة GMUHeatmapTileLayer.map مع تمرير nil.
Swift
heatmapLayer.map=nil
Objective-C
_heatmapLayer.map=nil;
مشاهدة التطبيق التجريبي
للاطّلاع على مثال آخر لتنفيذ خريطة حرارية، يمكنك مراجعة
HeatmapViewController في التطبيق التجريبي الذي يتم توفيره مع مكتبة الأدوات المساعدة.
يوضّح لك دليل الإعداد كيفية تشغيل التطبيق التجريبي.
تاريخ التعديل الأخير: 2025-07-26 (حسب التوقيت العالمي المتفَّق عليه)
[null,null,["تاريخ التعديل الأخير: 2025-07-26 (حسب التوقيت العالمي المتفَّق عليه)"],[[["\u003cp\u003eHeatmaps visualize the density of data points on a map using color, offering an alternative to markers for large datasets.\u003c/p\u003e\n"],["\u003cp\u003eThe \u003ccode\u003eGMUHeatmapTileLayer\u003c/code\u003e class is used to create heatmaps, accepting \u003ccode\u003eGMUWeightedLatLng\u003c/code\u003e objects for data points.\u003c/p\u003e\n"],["\u003cp\u003eHeatmaps can be customized by adjusting properties like radius, gradient, and opacity using the \u003ccode\u003eGMUHeatmapTileLayer\u003c/code\u003e instance.\u003c/p\u003e\n"],["\u003cp\u003eTo update the heatmap's data or options, modify the relevant properties and then call \u003ccode\u003eclearTileCache()\u003c/code\u003e to refresh the display.\u003c/p\u003e\n"],["\u003cp\u003eHeatmaps can be removed from the map by setting the \u003ccode\u003emap\u003c/code\u003e property of the \u003ccode\u003eGMUHeatmapTileLayer\u003c/code\u003e to \u003ccode\u003enil\u003c/code\u003e.\u003c/p\u003e\n"]]],["Heatmaps display data density on maps using color, offering an alternative to markers. To add one, create a `GMUHeatmapTileLayer` instance, setting its `map` property to `GMSMapView`. Then, supply `GMUWeightedLatLng` objects representing data coordinates to this instance and call `GMUHeatmapTileLayer.map`. Customize heatmaps by adjusting `radius`, `gradient`, and `opacity` properties. To modify data or settings, update values and call `GMUHeatmapTileLayer.clearTileCache()`. To remove the heatmap, set the `map` property to `nil`.\n"],null,["Select platform: [Android](/maps/documentation/android-sdk/utility/heatmap \"View this page for the Android platform docs.\") [iOS](/maps/documentation/ios-sdk/utility/heatmap \"View this page for the iOS platform docs.\") [JavaScript](/maps/documentation/javascript/heatmaplayer \"View this page for the JavaScript platform docs.\")\n\n\u003cbr /\u003e\n\nThis page describes the heatmap utility that's available in the [utility\nlibrary for the\nMaps SDK for iOS](https://github.com/googlemaps/google-maps-ios-utils).\nHeatmaps are useful for representing the distribution and\ndensity of data points on a map.\n\nThis video discusses the use of heatmaps as an alternative to markers, when\nyour data requires a large number of data points on the map. \n\nHeatmaps make it easy for viewers to understand the distribution and relative\nintensity of data points on a map. Rather than placing a marker at each\nlocation, heatmaps use color to represent the distribution of the data.\n\nIn the example below, red represents areas of high concentration of police\nstations in Victoria, Australia.\nA heatmap on a map **Note:** You can set your own colors for the heatmap, using the `gradient` property. See how to [customize](#customize) colors and other properties of your heatmap.\n\nIf you haven't yet set up the library, follow the [setup\nguide](/maps/documentation/ios-sdk/utility/setup) before reading the rest of\nthis page.\n\nAdding a simple heatmap\n\nTo add a heatmap to your map, you will need a dataset consisting of the\ncoordinates for each location of interest. First, create a\n`GMUHeatmapTileLayer` instance, setting the `map` property to a `GMSMapView`.\nDo this in your app's `viewDidLoad()` function, to ensure that the base map is\nloaded before working with the heatmap. Then pass a collection of\n`GMUWeightedLatLng` objects to the `GMUHeatmapTileLayer` instance.\n\nThe utility supplies the `GMUHeatmapTileLayer` class, which accepts a\ncollection of `GMUWeightedLatLng` objects. It creates the tile images for\nvarious zoom levels, based on the radius, gradient and opacity options\nsupplied.\n\nLooking at the steps in more detail:\n\n1. Create a `GMUHeatmapTileLayer` instance, setting the `map` property to a `GMSMapView` (do this in your app's `viewDidLoad()` function).\n2. Pass a collection of `GMUWeightedLatLng` objects to the `GMUHeatmapTileLayer` instance.\n3. Call `GMUHeatmapTileLayer.map`, passing the map view. \n\n Swift \n\n ```swift\n class Heatmap: UIViewController {\n\n private var mapView: GMSMapView!\n private var heatmapLayer: GMUHeatmapTileLayer!\n\n override func viewDidLoad() {\n super.viewDidLoad()\n heatmapLayer = GMUHeatmapTileLayer()\n heatmapLayer.map = mapView\n }\n\n // ...\n\n func addHeatmap() {\n\n // Get the data: latitude/longitude positions of police stations.\n guard let path = Bundle.main.url(forResource: \"police_stations\", withExtension: \"json\") else {\n return\n }\n guard let data = try? Data(contentsOf: path) else {\n return\n }\n guard let json = try? JSONSerialization.jsonObject(with: data, options: []) else {\n return\n }\n guard let object = json as? [[String: Any]] else {\n print(\"Could not read the JSON.\")\n return\n }\n\n var list = [GMUWeightedLatLng]()\n for item in object {\n let lat = item[\"lat\"] as! CLLocationDegrees\n let lng = item[\"lng\"] as! CLLocationDegrees\n let coords = GMUWeightedLatLng(\n coordinate: CLLocationCoordinate2DMake(lat, lng),\n intensity: 1.0\n )\n list.append(coords)\n }\n\n // Add the latlngs to the heatmap layer.\n heatmapLayer.weightedData = list\n }\n }\n \n ```\n\n Objective-C \n\n ```objective-c\n @implementation Heatmap {\n GMSMapView *_mapView;\n GMUHeatmapTileLayer *_heatmapLayer;\n }\n\n - (void)viewDidLoad {\n [super viewDidLoad];\n _heatmapLayer = [[GMUHeatmapTileLayer alloc] init];\n _heatmapLayer.map = _mapView;\n }\n\n // ...\n\n - (void) addHeatmap {\n\n // Get the data: latitude/longitude positions of police stations.\n NSURL *path = [NSBundle.mainBundle URLForResource:@\"police_stations\" withExtension:@\"json\"];\n NSData *data = [NSData dataWithContentsOfURL:path];\n NSArray *json = [NSJSONSerialization JSONObjectWithData:data options:0 error:nil];\n\n NSMutableArray\u003cGMUWeightedLatLng *\u003e *list = [[NSMutableArray alloc] init];\n [json enumerateObjectsUsingBlock:^(id _Nonnull obj, NSUInteger idx, BOOL * _Nonnull stop) {\n NSDictionary *item = (NSDictionary *)obj;\n CLLocationDegrees lat = [(NSNumber *) [item valueForKey:@\"lat\"] doubleValue];\n CLLocationDegrees lng = [(NSNumber *) [item valueForKey:@\"lng\"] doubleValue];\n GMUWeightedLatLng *coords = [[GMUWeightedLatLng alloc] initWithCoordinate:CLLocationCoordinate2DMake(lat, lng)\n intensity:1.0];\n [list addObject:coords];\n }];\n\n\n // Add the latlngs to the heatmap layer.\n _heatmapLayer.weightedData = list;\n }\n @end\n \n ```\n\nFor this example, the data is stored in a JSON file, `police_stations.json`.\nHere is an extract from the file: \n\n [\n {\"lat\" : -37.1886, \"lng\" : 145.708 } ,\n {\"lat\" : -37.8361, \"lng\" : 144.845 } ,\n {\"lat\" : -38.4034, \"lng\" : 144.192 } ,\n {\"lat\" : -38.7597, \"lng\" : 143.67 } ,\n {\"lat\" : -36.9672, \"lng\" : 141.083 }\n ]\n\nCustomizing the heatmap\n\nThe heatmap has several customizable properties. You can set the options when\ninitially creating the `GMUHeatmapTileLayer` instance, or at any time by\nsetting a new value for the option.\n\nThe following options are available:\n\n1. **Radius:** The size of the Gaussian blur applied to the heatmap, expressed\n in pixels. The default is 20. Must be between 10 and 50. Use\n `GMUHeatmapTileLayer.radius` to set the radius.\n\n2. **Gradient:** A range of colors that the heatmap uses to generate its color\n map, ranging from lowest to highest intensity. A `GMUGradient` is created using\n an integer array containing the colors, and a float array indicating the\n starting point for each color, given as a percentage of the maximum intensity,\n and expressed as a fraction from 0 to 1. You need to specify only one color for\n a single-colored gradient, or a minimum of two colors for a multi-colored\n gradient. The color map is generated using interpolation between those colors.\n The default gradient has two colors. The `colorMapSize` parameter defines the\n number of steps in the gradient. Larger numbers will result in a smoother\n gradient, while smaller numbers will give sharper transitions similar to a\n contour graph. Use `GMUHeatmapTileLayer.gradient` to set the gradient.\n\n3. **Opacity:** This is the opacity of the entire heatmap layer, and ranges\n from 0 to 1. The default is 0.7. Use `GMUHeatmapTileLayer.opacity` to set the\n opacity value.\n\nFor example, create a `Gradient`:\n\n\nSwift \n\n```swift\nlet gradientColors: [UIColor] = [.green, .red]\nlet gradientStartPoints: [NSNumber] = [0.2, 1.0]\nheatmapLayer.gradient = GMUGradient(\n colors: gradientColors,\n startPoints: gradientStartPoints,\n colorMapSize: 256\n)\n \n```\n\nObjective-C \n\n```objective-c\nNSArray\u003cUIColor *\u003e *gradientColors = @[UIColor.greenColor, UIColor.redColor];\nNSArray\u003cNSNumber *\u003e *gradientStartPoints = @[@0.2, @1.0];\n_heatmapLayer.gradient = [[GMUGradient alloc] initWithColors:gradientColors\n startPoints:gradientStartPoints\n colorMapSize:256];\n \n```\n\n\u003cbr /\u003e\n\nTo change the opacity of an existing heatmap:\n\n\nSwift \n\n```swift\nheatmapLayer.opacity = 0.7\n \n```\n\nObjective-C \n\n```objective-c\n_heatmapLayer.opacity = 0.7;\n \n```\n\n\u003cbr /\u003e\n\nUpdate an existing option\n\nTo update an option that has already been set, take these steps:\n\n1. Update the option to the desired value.\n2. Call `GMUHeatmapTileLayer.clearTileCache()`.\n\nChanging the dataset\n\nTo change the dataset upon which a heatmap is built:\n\n1. Update your data collection. Use `GMUHeatmapTileLayer.weightedData`, passing an array of `GMUWeightedLatLng`.\n2. Call `GMUHeatmapTileLayer.clearTileCache()`.\n\n| **Note:** if you want to add points to the heatmap, or remove points from the heatmap, first update your data collection and then use `GMUHeatmapTileLayer.weightedData`.\n\nRemoving a heatmap\n\nTo remove a heatmap, call `GMUHeatmapTileLayer.map`, passing `nil`.\n\n\nSwift \n\n```swift\nheatmapLayer.map = nil\n \n```\n\nObjective-C \n\n```objective-c\n_heatmapLayer.map = nil;\n \n```\n\n\u003cbr /\u003e\n\nSee the demo app\n\nFor another example of a heatmap implementation, take a look at the\n`HeatmapViewController` in the demo app that ships with the utility library.\nThe [setup guide](/maps/documentation/ios-sdk/utility/setup) shows you how to\nrun the demo app."]]