Best practices for 3D Maps

This guide provides a detailed look at 3D Maps Web components and considerations when integrating with your application.

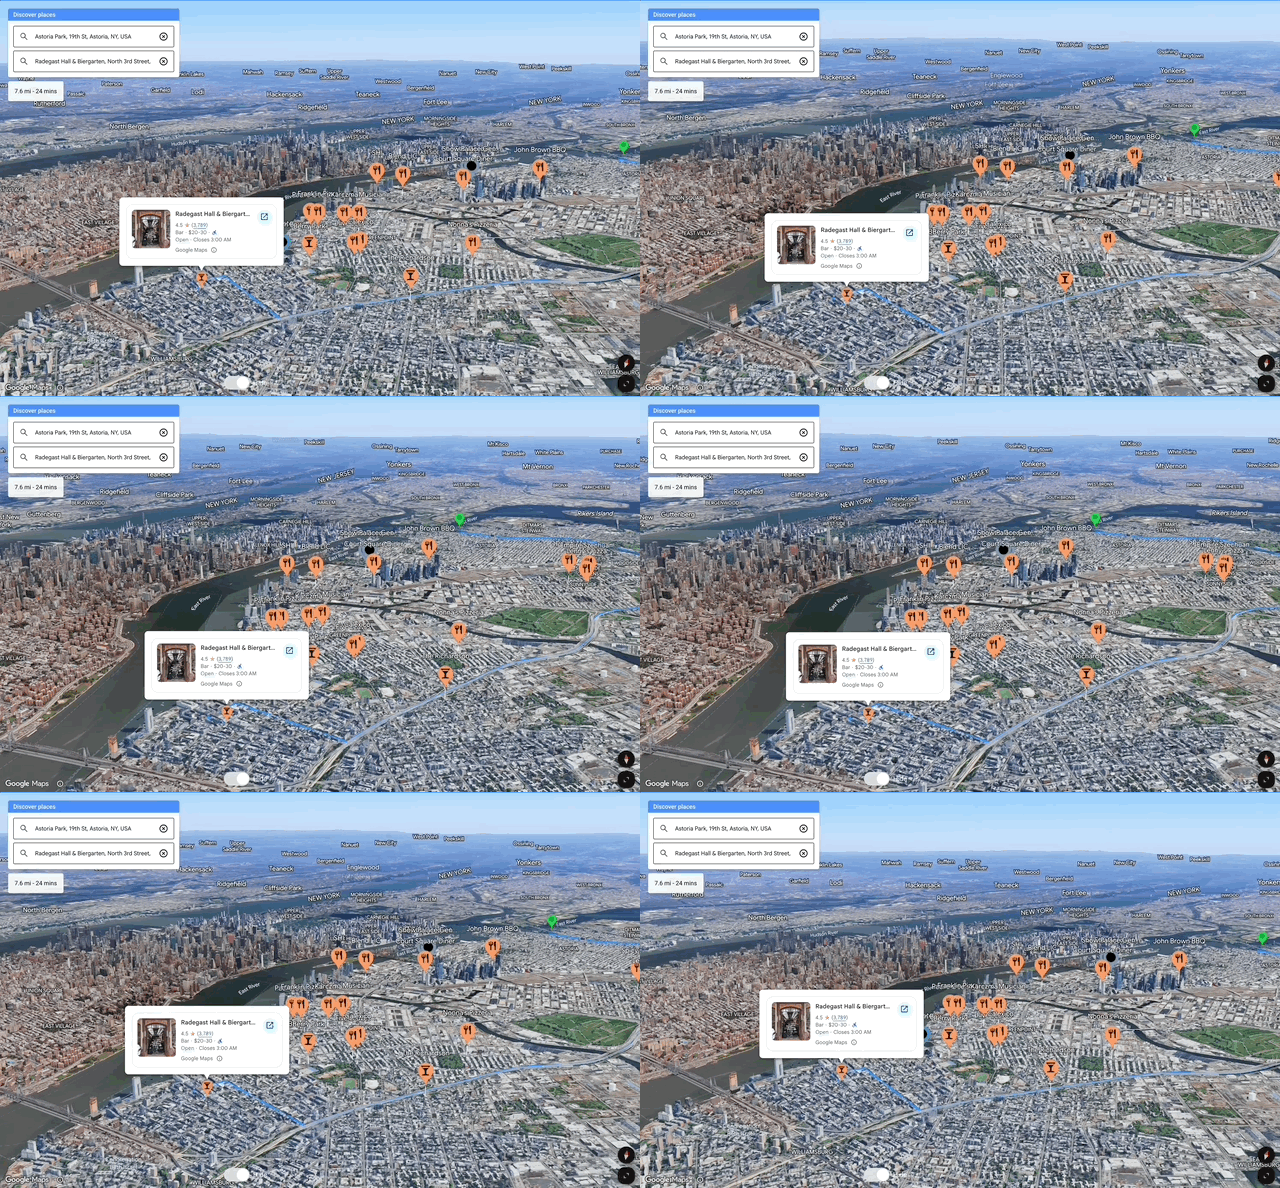
Example use case for place search and route finding.
Place search and route finding example.

Performance Considerations

To ensure a smooth and responsive experience for interactivity and visual elements, consider the following approaches.

Load the Map

The initial load and rendering setup of the 3D Maps combines browser configuration techniques and UI best practices for optimal user experience.

  • API load: Use 3D Maps async dynamic loading for loading the Maps JavaScript API at initial page load.
  • Libraries: Load libraries programmatically where needed such as google.maps.importLibrary("maps3d"). Alternatively, if you use web components like <gmp-map-3d> directly in your HTML page with direct script loading, the libraries will load automatically at the appropriate time
  • Manage basemap features: Use a custom mapId to filter basemap POIs (HYBRID mode), and control their density, especially if the application has its own set of custom elements such as markers or polylines. This prevents visual clutter and potential overlap. Alternatively, you can disable basemap vector tiles features such as POIs, roads polylines, road names, street names (SATELLITE mode).
  • Events: Listen to gmp-steadystate or gmp-error events to build your subsequent logic such as loading markers, animating the camera.
Map loading sequence
Background canvas > Minified tiles > Terrain mesh > Surface mesh (e.g.:buildings) > Points of Interest & Road labels, Custom elements being loaded in parallel (markers, 3d models, etc.)
  • User interaction: Wait for the gmp-steadystate event before making changes to the map's content. If a user starts interacting (pan, zoom) with the map before the initial gmp-steadystate event then the event will only trigger after the user stops interacting. Avoid displaying or updating overlay content (like markers or polygons) while the user pans or zooms the map, avoid displaying or updating overlay content (like markers or polygons) by listening to gmp-centerchange, gmp-headingchange gmp-rangechange gmp-rollchange gmp-tiltchange.

  • Use requestAnimationFrame() (rAF) for continuous updates and strictly separate intensive calculations from draw calls.

    • Use rAF: Synchronizes updates with the browser's display rate for smooth, 60FPS animation and reduced power consumption.
    • Avoid Intensive Draw Work: Don't perform heavy, non-drawing tasks during the final update.
    • Separate Logic: Perform all intensive logic before minimal web component update calls within the rAF loop.
  • Initial scene settings: <gmp-map-3d> Camera Settings such as Tilt will affect loading speed. The more the scene is zoomed or tilted, the more detailed polygons will be displayed and require loading. The level of detail will also depend on the location (e.g.: city with many buildings versus countryside with natural features only).

    • Prefer less zoomed-in (high altitude), low or non-tilted views.
    • Add bounds (sample) to the map so that users stay focused on a particular area and the tiles can load fully.
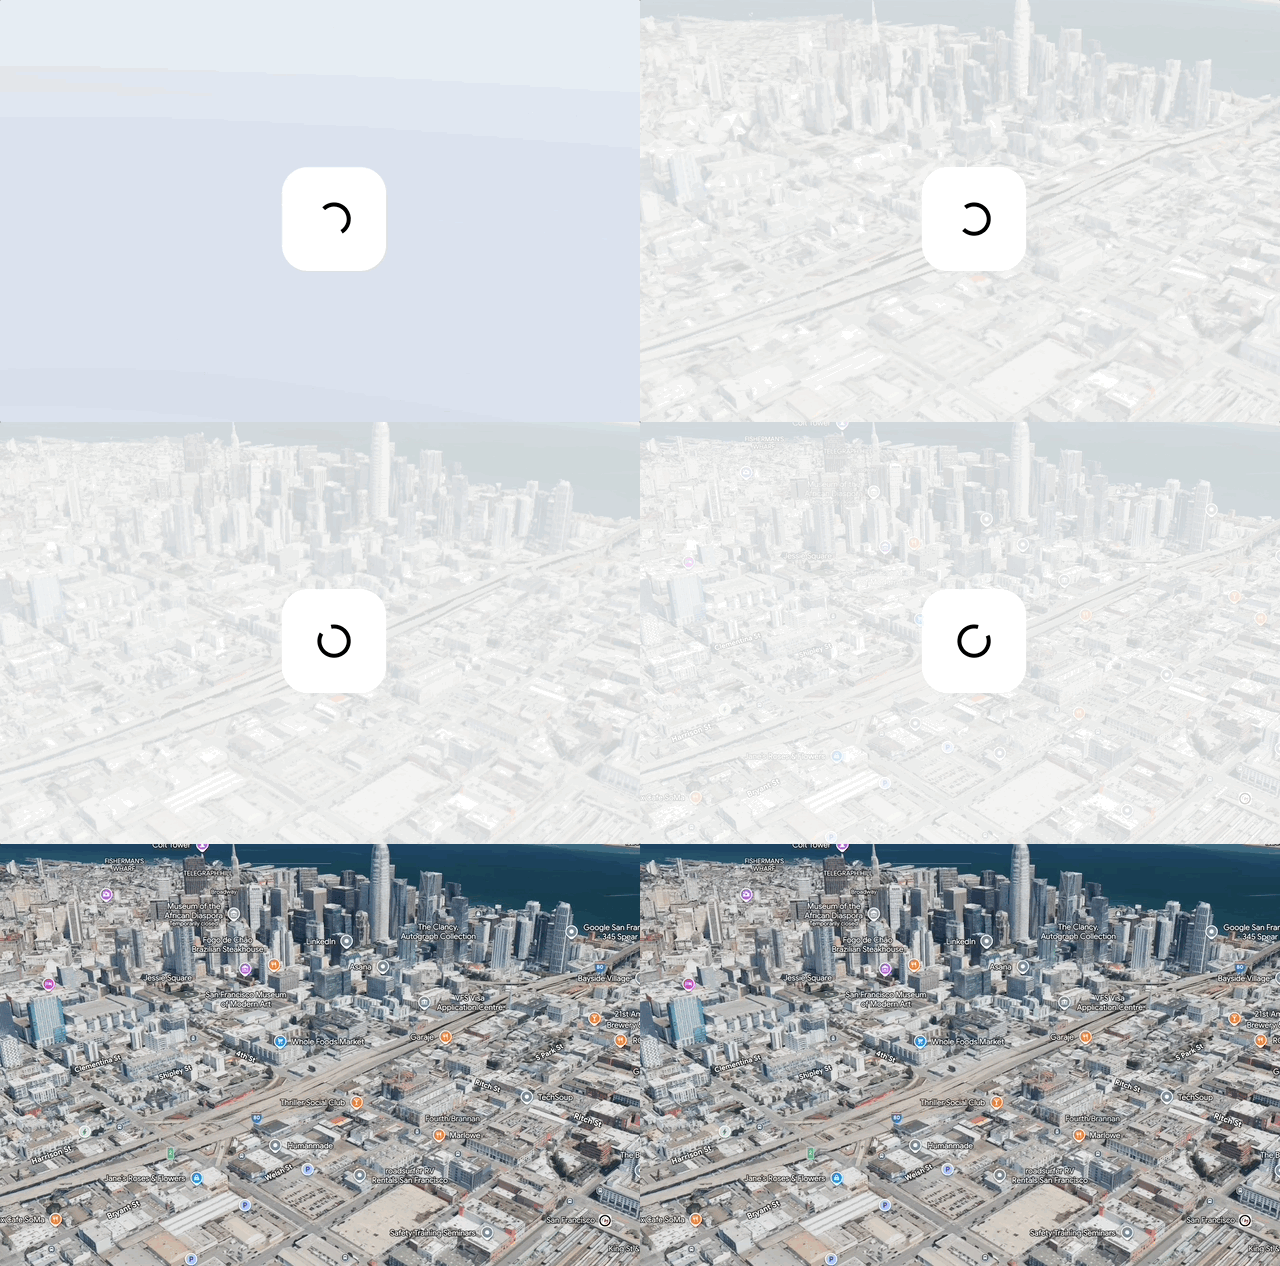
  • Preloader visual: While <gmp-map-3d> loads extremely fast, it may take some time to display in full resolution for users with low end devices (low GPU), or bandwidth (slow 4G). In this case you can create a preloader with image, animation or text with the 3D scene loading in the background. See key event to use below:

Preloader example
Preloader example
// create the map in the background and wait for gmp-steadychange event
async function initMap() {
    await google.maps.importLibrary("maps3d");
    const map = document.querySelector('gmp-map-3d');
    const div = document.querySelector('div'); // preloader "
    map.addEventListener('gmp-steadychange', ({isSteady}) => {
        if (isSteady) {
            div.style.display = 'none';
        }
    });
}
initMap();
  • 2D map:
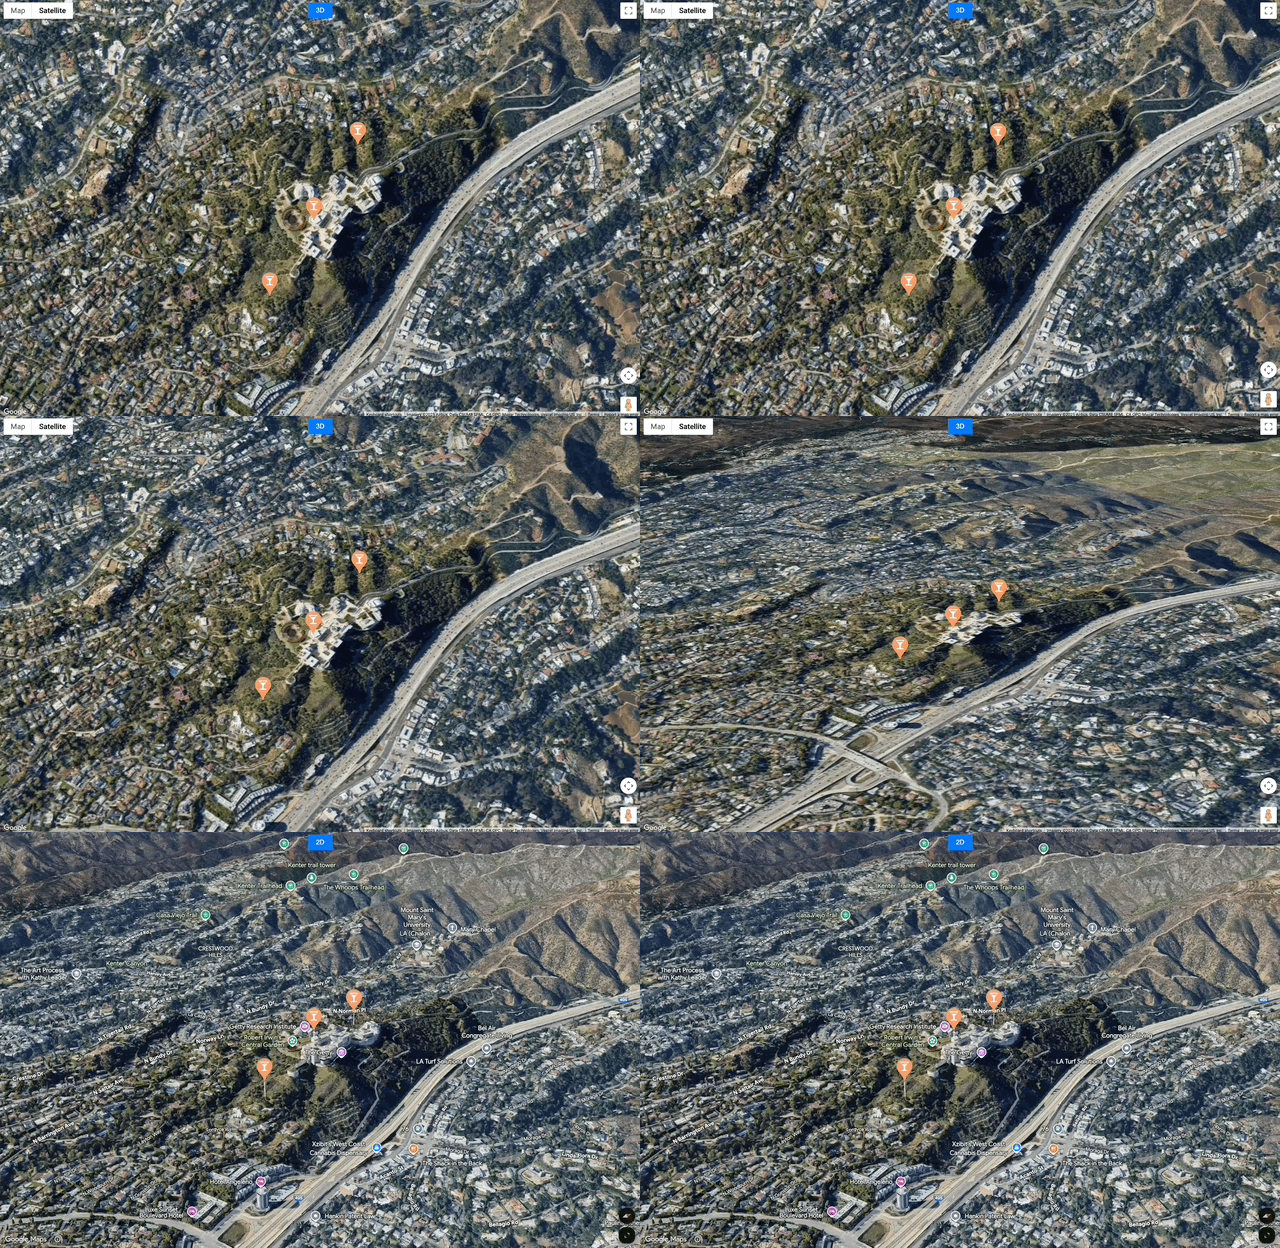
    • An alternative 2D map (SATELLITE) can be delivered to these users while still including your geo data such as markers.
Satellite map example
  • Alternatively a complementary 2D Static map in SATELLITE mode can be displayed for users to visualize a given place while loading.

Visual Elements Performance and Management

3D Maps offers several ways to display visual elements like markers, polylines, polylines and 3D models with optimal performance and minimal time to render, even for higher volume visuals.

Markers

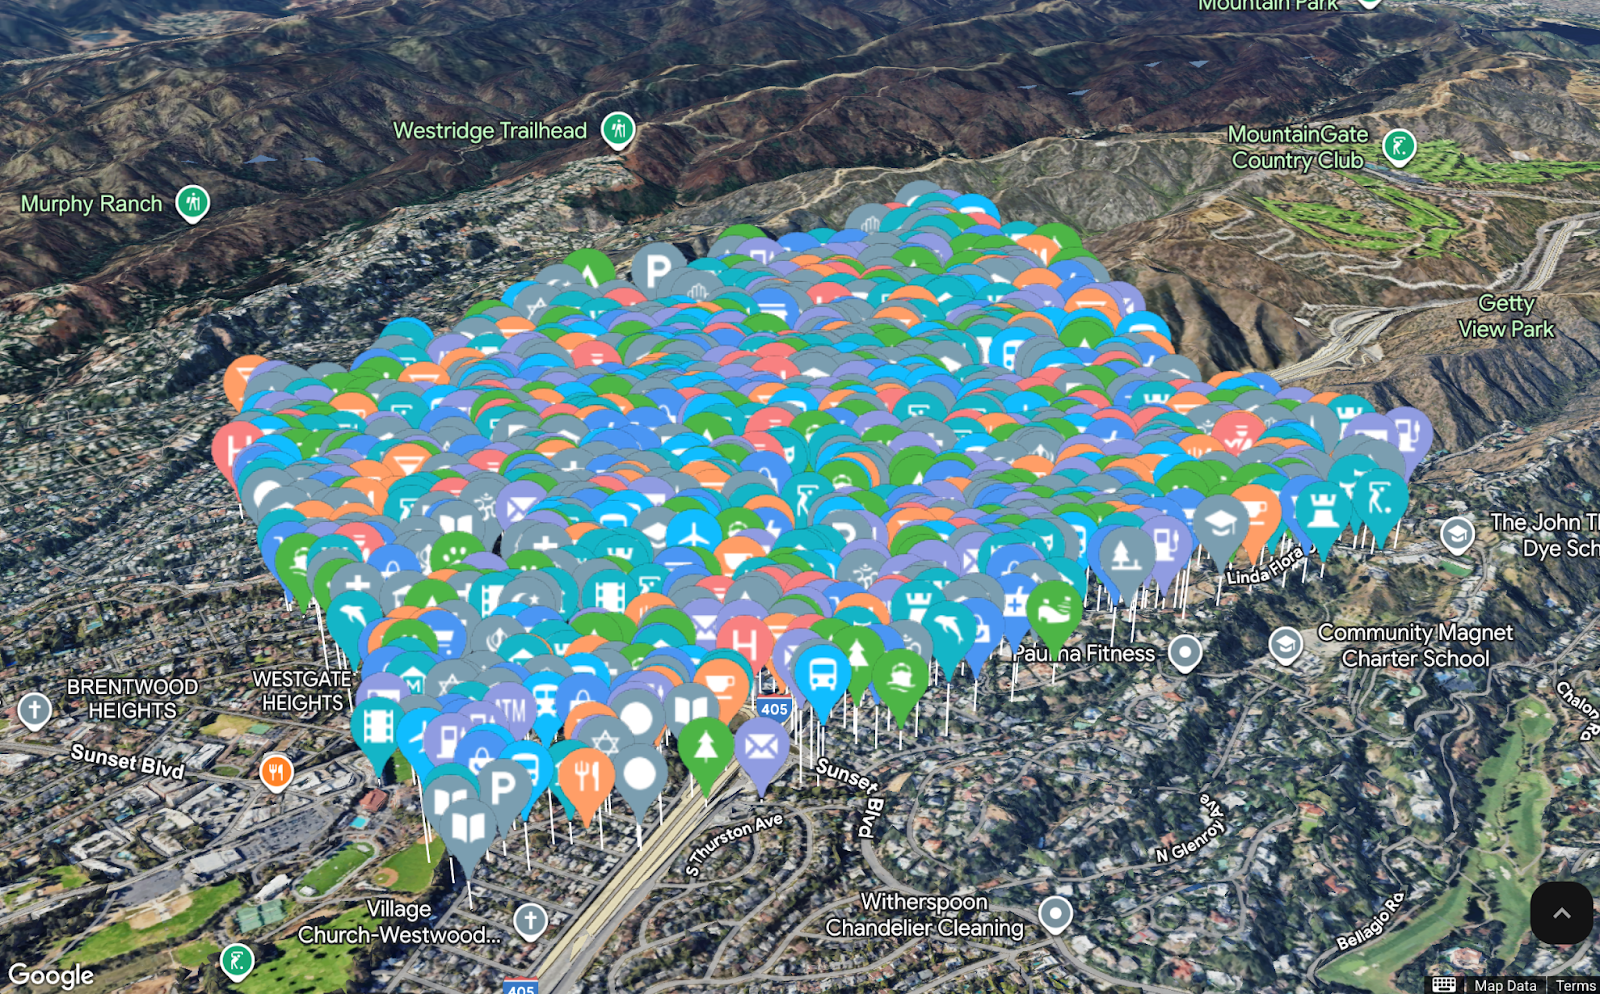
Marker loading example
Example scenario: 150-300ms to load 300 markers with 41 different svg marker glyph (modern laptop: macOS M3 Pro, Chrome)
  • Optimal Customization Choice:
    • PinElement: For basic marker changes (color, scale, border, text glyph), use the <gmp-pin> element or the PinElement class. This is the most performant customization method.
    • Use HTMLImageElement or SVGElement Markers Sparingly: Use for more customization like adding transparency or injecting an image such as an icon into a SVGElement (requires base64 encoding). They will be rasterized on load and involve performance overhead. HTMLImageElement and SVGElement must be wrapped in <template> element before assigning to the Marker3DElement's default slot.
    • Adding plain HTML or CSS is not available for now.
  • Manage Collision Behavior: Take advantage of the marker's collisionBehavior property. For critical markers that must always be visible, set the behavior accordingly. For less important markers, allow them to hide to maintain a cleaner, less cluttered map experience, especially at high zoom levels.
  • Critical POIs Only: Only use drawsWhenOccluded (or set the property programmatically) for markers that absolutely must be seen through buildings or terrain (e.g., a rescue target, a buried utility line, or a user's avatar).
  • Test Occlusion: Since the map is 3D, markers can be visually obscured (occluded) by buildings or terrain. Test different camera angles and marker altitudes to ensure crucial POIs remain visible or implement logic to adjust visibility and altitude when occluded.
  • Leverage Altitude: In 3D maps, markers should use the position with an altitude value. For markers associated with the terrain or buildings, use altitudeMode: 'RELATIVE_TO_GROUND', 'RELATIVE_TO_MESH' or similar settings to ensure the marker anchors correctly when the map is tilted or rotated.

Polygons & Polylines

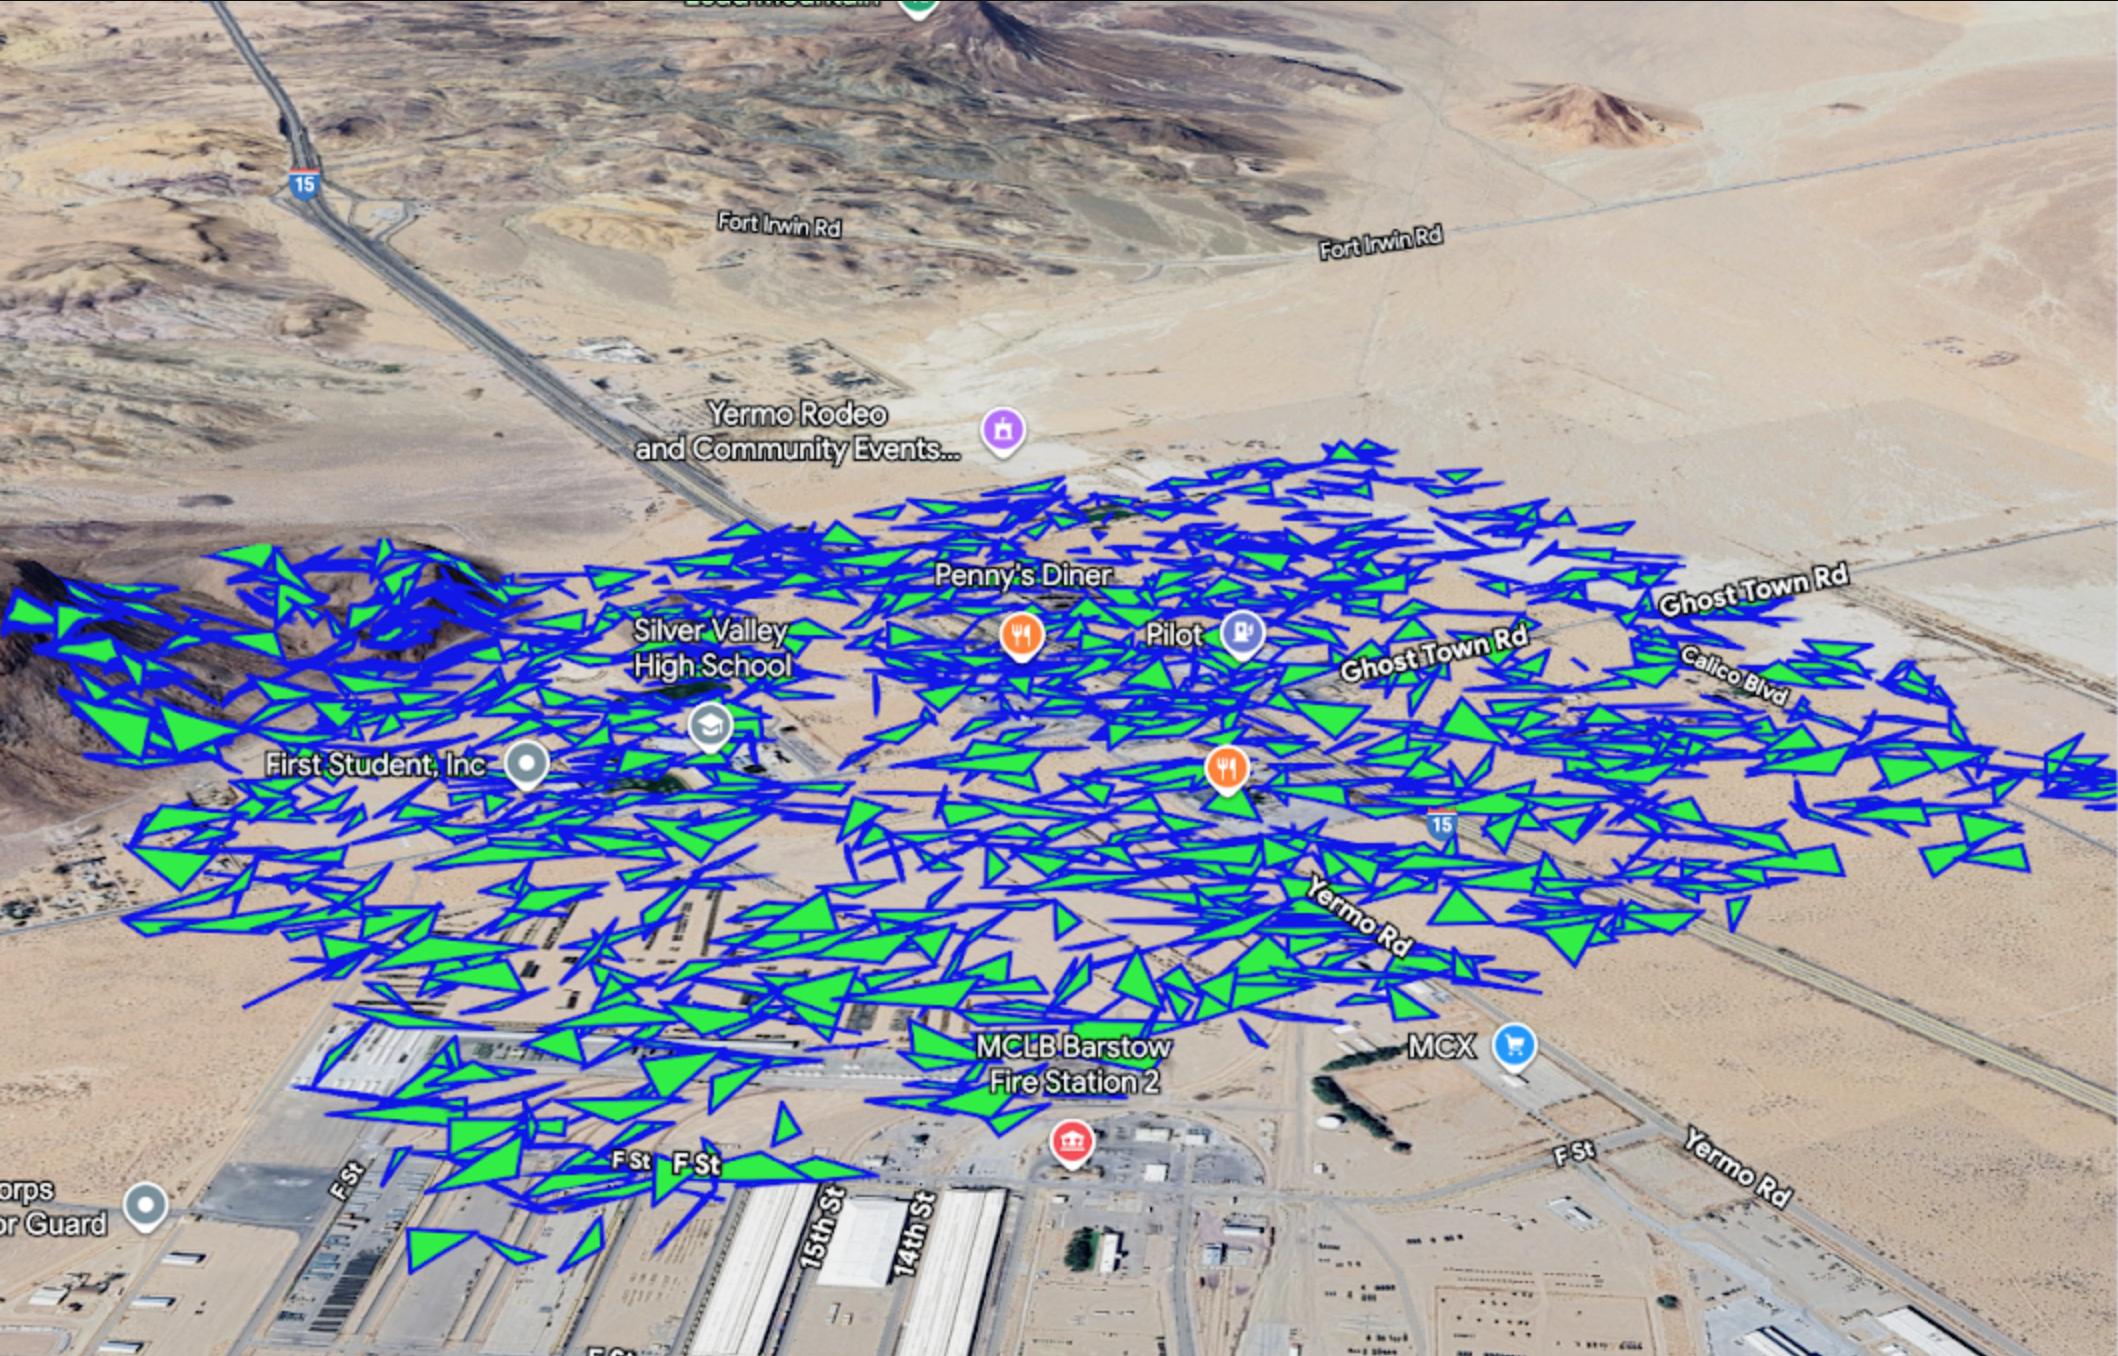
Polygon loading example
Example scenario: 100-150ms to load 1000 polygons (modern laptop: macOS M3 Pro, Chrome)
  • Simplify Geometry: Before rendering, apply a simplification algorithm to your path data. This reduces the number of vertices while retaining the general shape, drastically improving rendering speed, especially for complex boundaries or routes.
  • Decimation by Zoom Level: For very large datasets, consider loading higher-detail geometry only when the user is zoomed in to the area. At a low zoom level, only a highly simplified version of the polyline or polygon is necessary.
  • Pre-calculate for Extruded Polygons: If your polygons are extruded (extruded: true), the path data defines a 3D volume (a mesh). Processing complex, high-vertex polygons is computationally expensive. Ensure the source data for your polygons is as simple as possible.
  • Test Polyline and Polygon Performance: When adding numerous or complex Polylines/Polygons, especially when extruded for 3D, ensure they don't cause frame rate drops. Limit the number of vertices or use simplification algorithms if necessary.
  • When updating a shape, modify the entire path array in a single operation rather than looping and modifying individual elements. A single assignment operation (e.g., polyline.path = newPathArray;) is much more efficient than multiple iterative updates.
  • Avoid Extruded Polylines (where possible): While Polylines can use an altitude value to be placed in 3D space, extruding a Polyline (e.g., giving it stroke-width and a large altitude span) can be graphically intensive. Whenever possible, use 2D polylines on the ground (RELATIVE_TO_GROUND) or a minimal stroke-width for better performance.
  • Only use drawsOccludedSegments for critical routing elements. For background or contextual shapes, allow them to be naturally occluded by the 3D geometry of the map. Showing non-critical hidden geometry adds unnecessary rendering complexity.

3D Models

3D model .glb rendering and interactivity such as gmp-click event are very fast in <gmp-map-3d>.

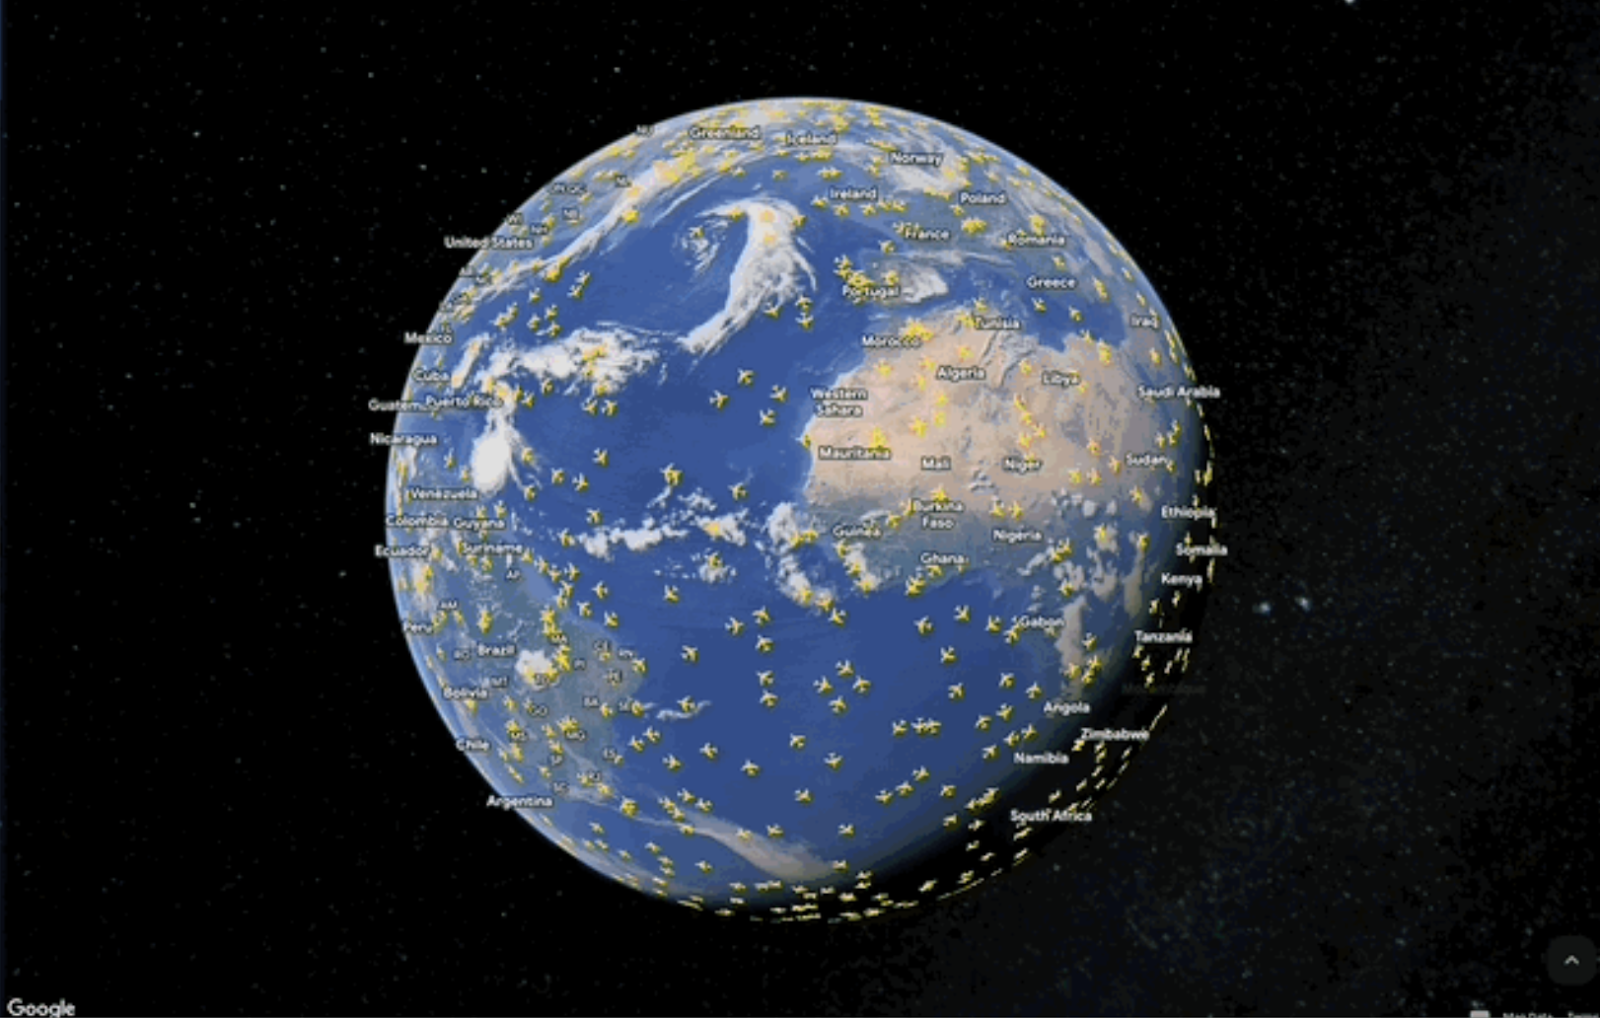
3D model loading example
Example scenario: Takes around 2 seconds to display 1000 occurrences of a light 3D model (200KB) moving along a path. (modern laptop: macOS M3 Pro, Chrome)
  • Minimize File Size with Compression: To ensure quick loading, especially on mobile networks, keep complex .glb model files under 5MB (ideally less). The primary method for achieving this is to apply Draco Compression on the mesh data within your .glb files, which can significantly reduce the file size (often by over 50%) with minimal visual quality loss.
  • Center Model Origin: Ensure the 3D modeling software exports the model with its origin (0, 0, 0 point) centered at the base of the model. This simplifies positioning and rotation on the map, ensuring the model anchors correctly to the Lat, Lng coordinates.
  • Manage CORS: If your model files are hosted on a different domain or CDN than your web application, you must configure the hosting server to include the necessary Cross-Origin Resource Sharing (CORS) headers (e.g., Access-Control-Allow-Origin: *). The map cannot load the model otherwise.