优化数据可指导您分配下一个时间段的预算。Meridian 提供了多种查看预算优化数据的方法:
-
固定预算方案:有助于您在给定预算的情况下找到各渠道间的最佳分配方式,以最大限度提高总体投资回报率。
指定了目标投资回报率的灵活预算方案:有助于您最大限度地提高总的增量收入,同时保持总体投资回报率不低于最低目标值。
指定了目标边际投资回报率的灵活预算方案:有助于确定您在每个渠道上可以支出的最高金额,同时仍能在每个渠道上实现不低于最低目标值的边际投资回报率。
为使用覆盖面和频次数据的渠道计算最佳频次。
生成设定了自定义时间范围的双页优化 HTML 报告,这类报告可导出到您的 Google 云端硬盘。
生成优化结果摘要,从而自定义自己的报告、可视化图表,或将这些内容导出为其他格式。借助这些数值摘要,您可以了解更多详细信息,并按渠道细分结果,以便将优化后的结果与未经优化的结果进行比较。
绘制优化可视化图表,以比较使用了自定义限制条件、预算、数据和渠道名称的方案。
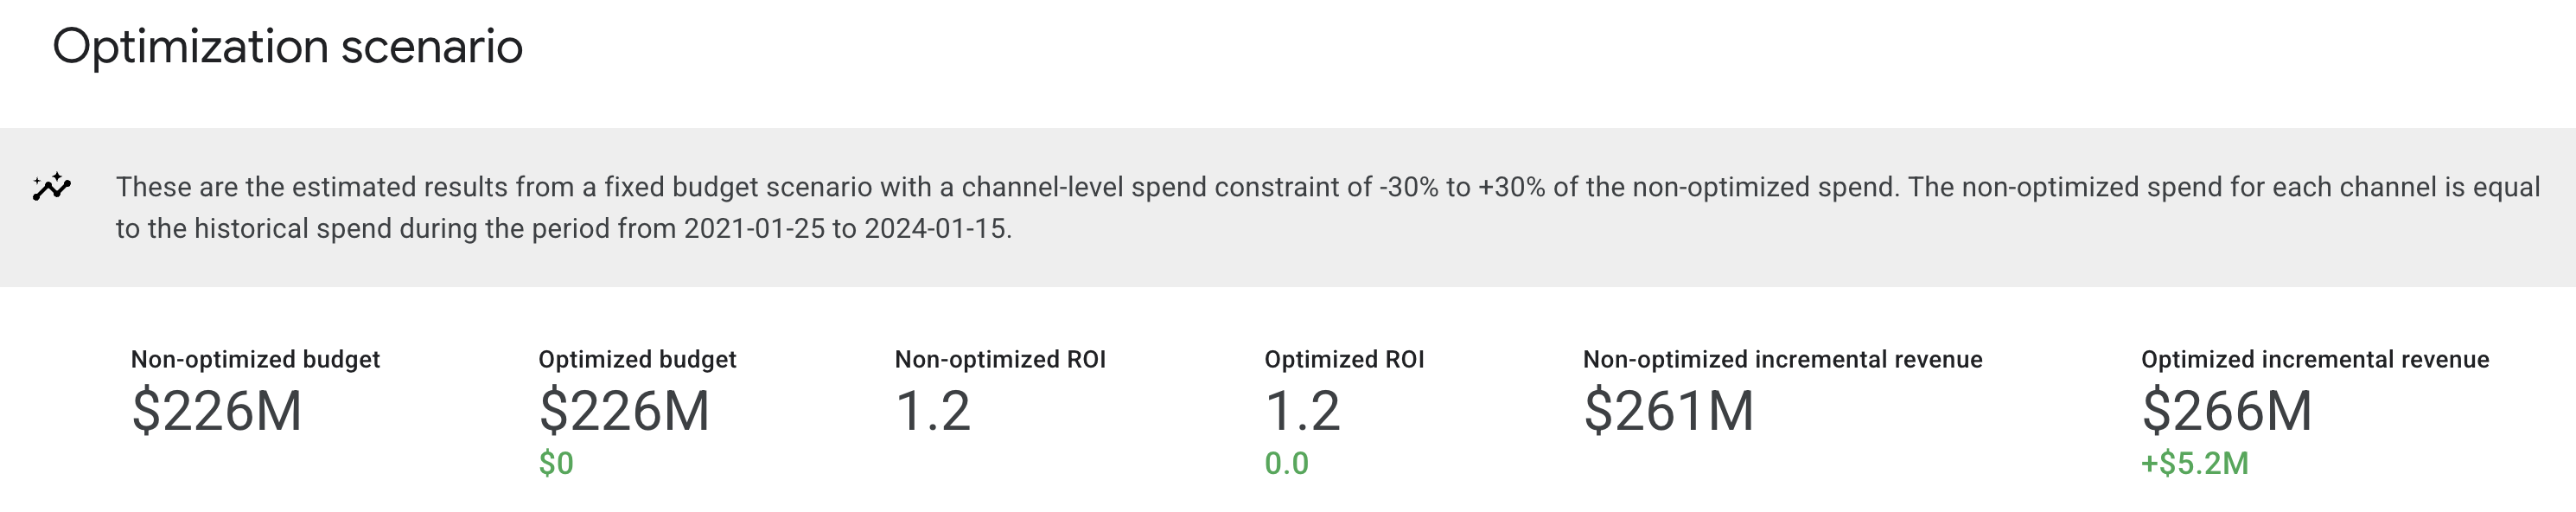
优化方案摘要
优化方案摘要表格仅在 HTML 输出中显示。该表格将针对您配置的方案类型,显示当前的(未经优化的)与优化后的预算、投资回报率以及增量收入或 KPI 的宏观比较。此外,此部分还会显示您指定的渠道级支出限制条件,以及预算优化的基准时间段。
以下示例显示了固定预算优化方案的估算结果。在本例中,当前的投资回报率与优化后的投资回报率之间没有显著变化。一般来说,优化后的投资回报率至少要与当前的投资回报率持平。
(点击图片可放大。)
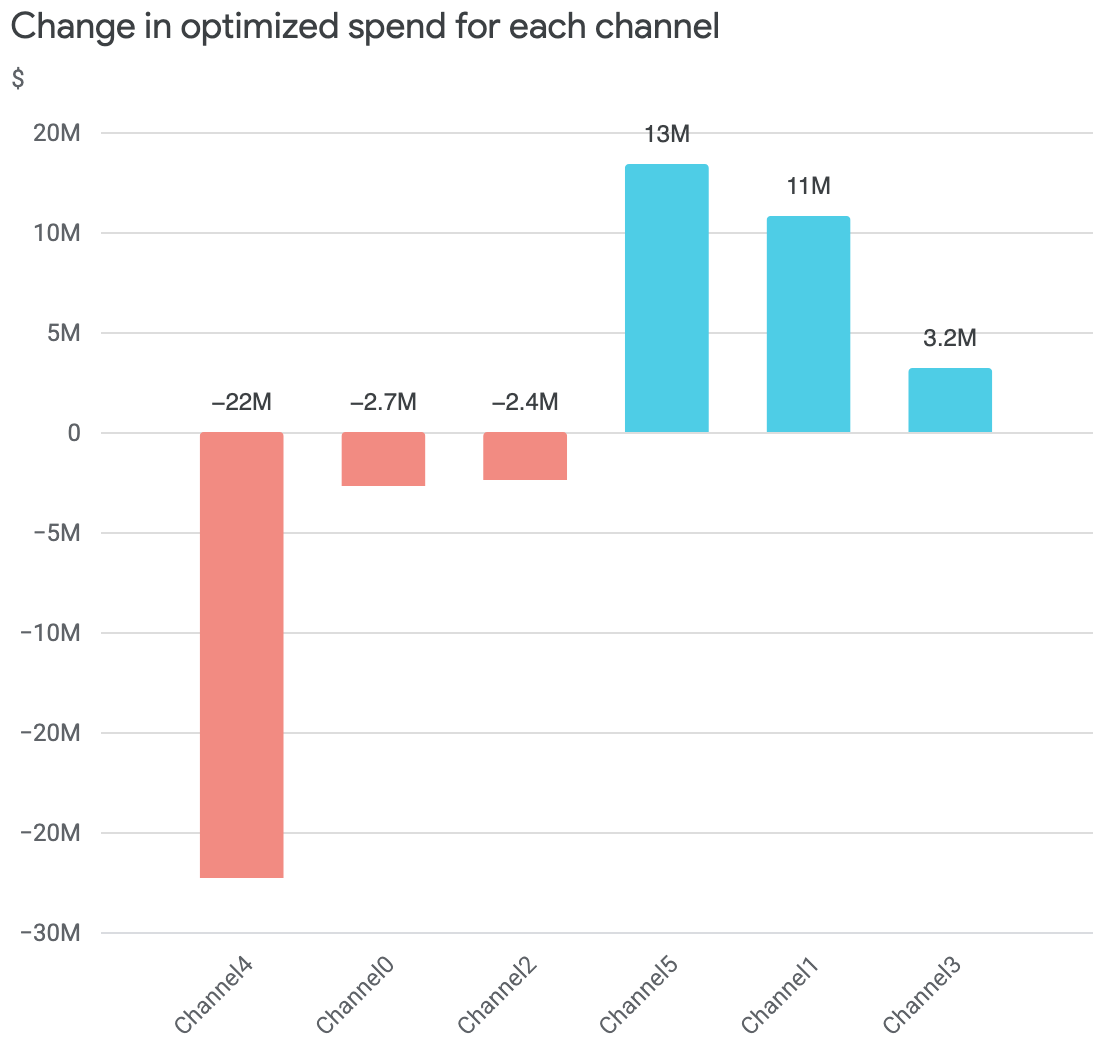
各渠道优化后支出的变动
此图表显示了预算优化建议的各渠道支出变动情况。变动是指优化后支出与当前支出之间的差额。
以下示例针对的是固定预算优化,因此净预算变动额为 0。
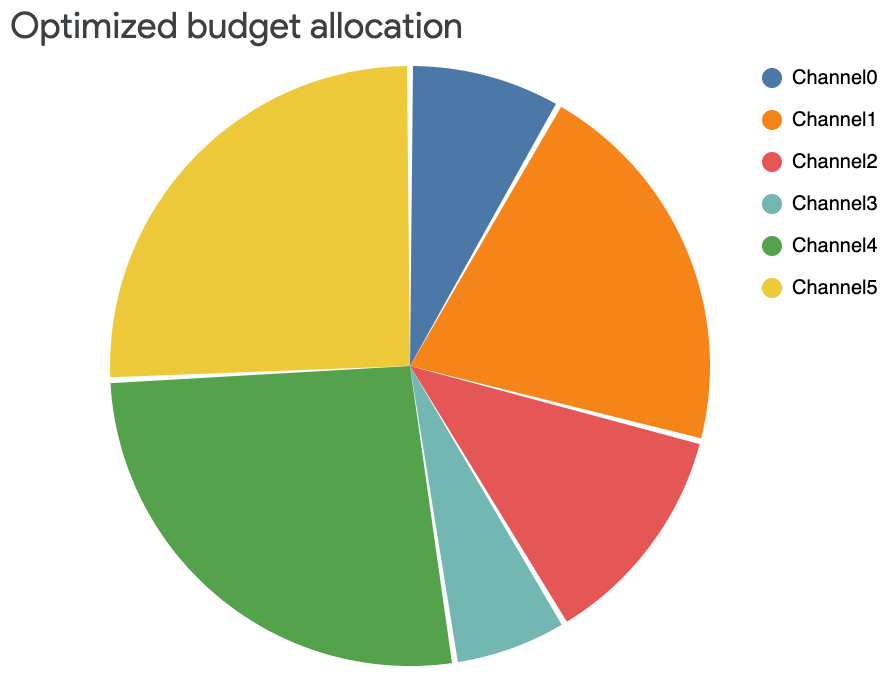
优化后的预算分配
优化后的预算分配表格会对未经优化的和优化后的预算方案中各个渠道的支出百分比进行比较。这有助于您根据优化后的预算方案,为每个渠道确定可行的预算变动。
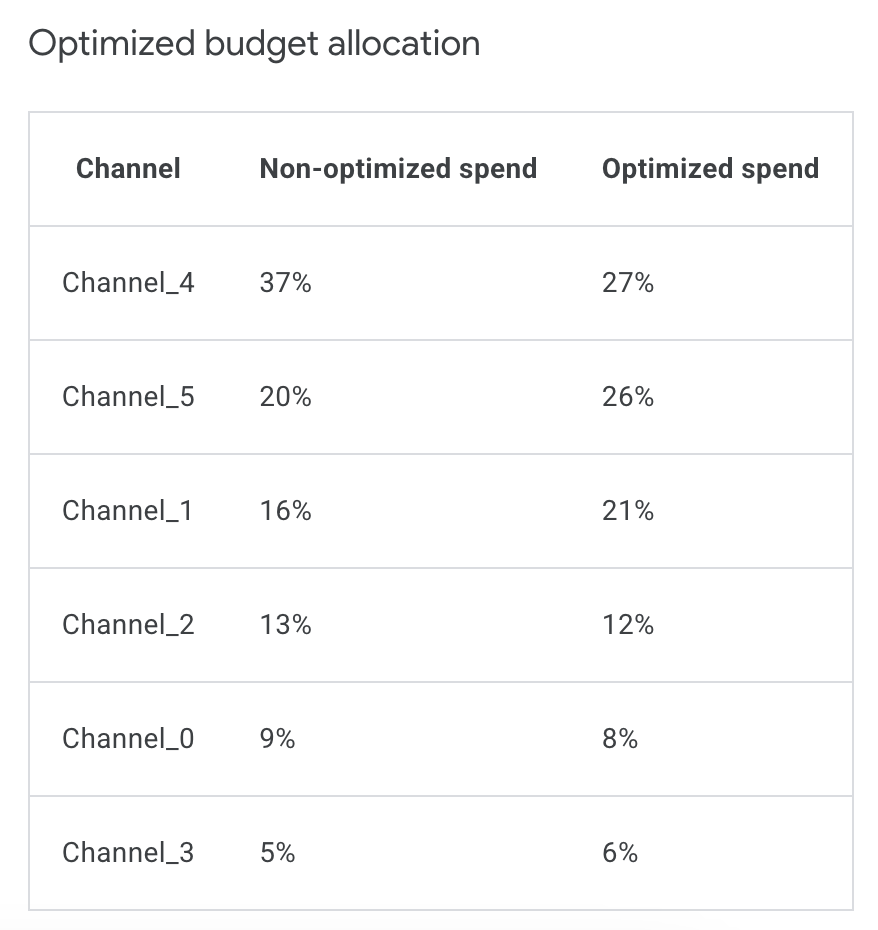
相应的饼图只会根据优化后的预算分配表格显示优化后的支出分配。在以下示例中可以看到,在优化后的总预算中,有将近一半分配给了渠道 4 和渠道 5。这是查看优化后的预算分配的另一种方式。
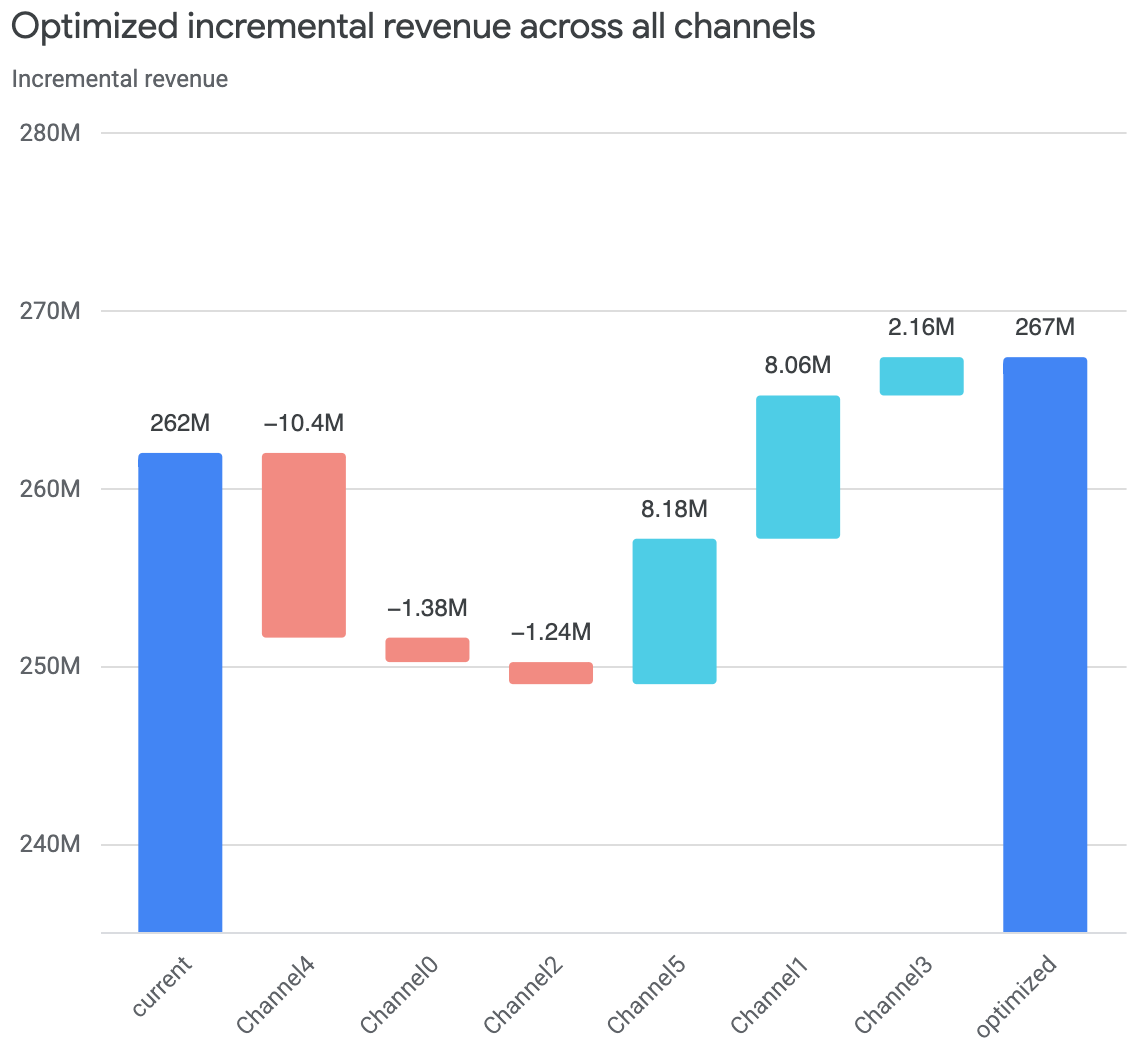
所有渠道优化后的增量收入
所有渠道优化后的增量收入图表显示了,从历史预算分配改为最佳预算分配后,最佳预算分配对各个渠道的预计影响,以及相关的影响差额。
此可视化图表会在最左侧显示当前的增量收入或 KPI。然后,它还会在最右侧显示建议在每个渠道实行的差额,以便达到优化后的增量收入或 KPI。
以下示例显示,当前收入为 2.62 亿。您可以看到,优化后的预算分配降低了某些渠道的增量收入,但增加了其他渠道的增量收入,最后使总体的增量收入增加至 2.67 亿。
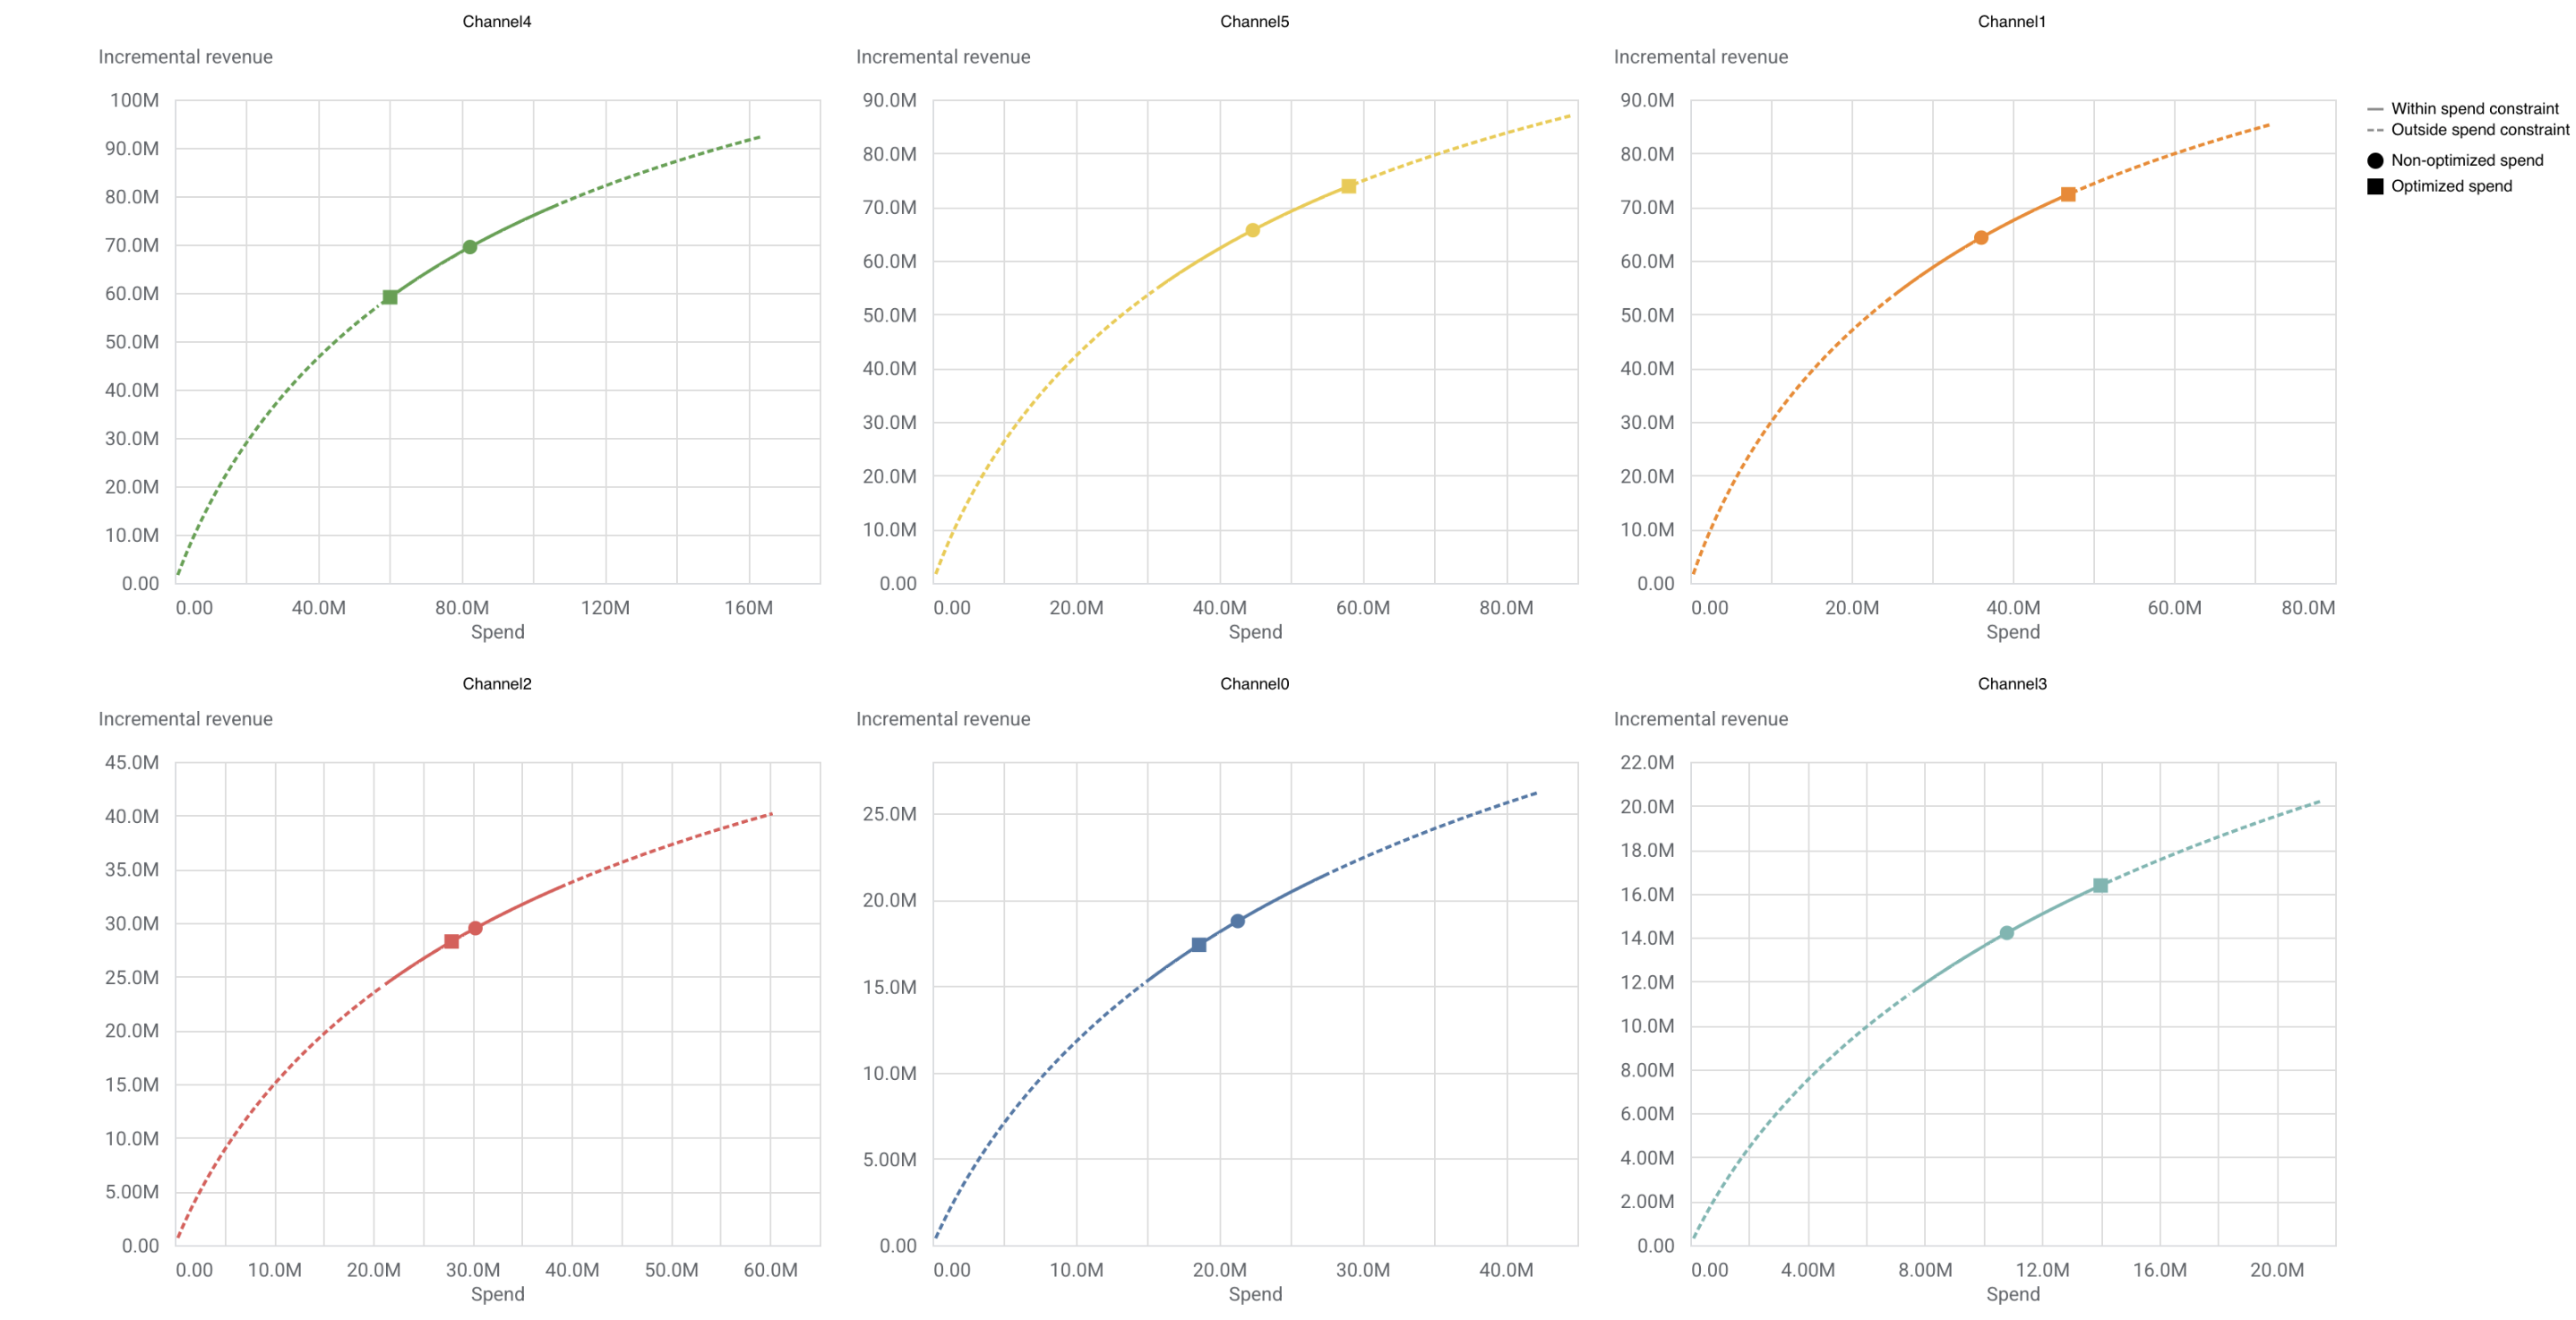
基于响应曲线的优化预算
响应曲线显示了增量收入与支出之间的函数关系。此曲线上的点表示当前支出水平和最佳支出水平。响应曲线显示了单位支出带来的回报最终会如何减少,这一信息可以进一步指导预算决策。
在响应曲线图表中,实线表示您为优化设置的支出限制范围。虚线表示超出限制范围的支出。
关于该图,还有两点需要说明:
- 圆圈表示当前的支出水平
- 方形表示优化后的支出水平
(点击图片可放大。)
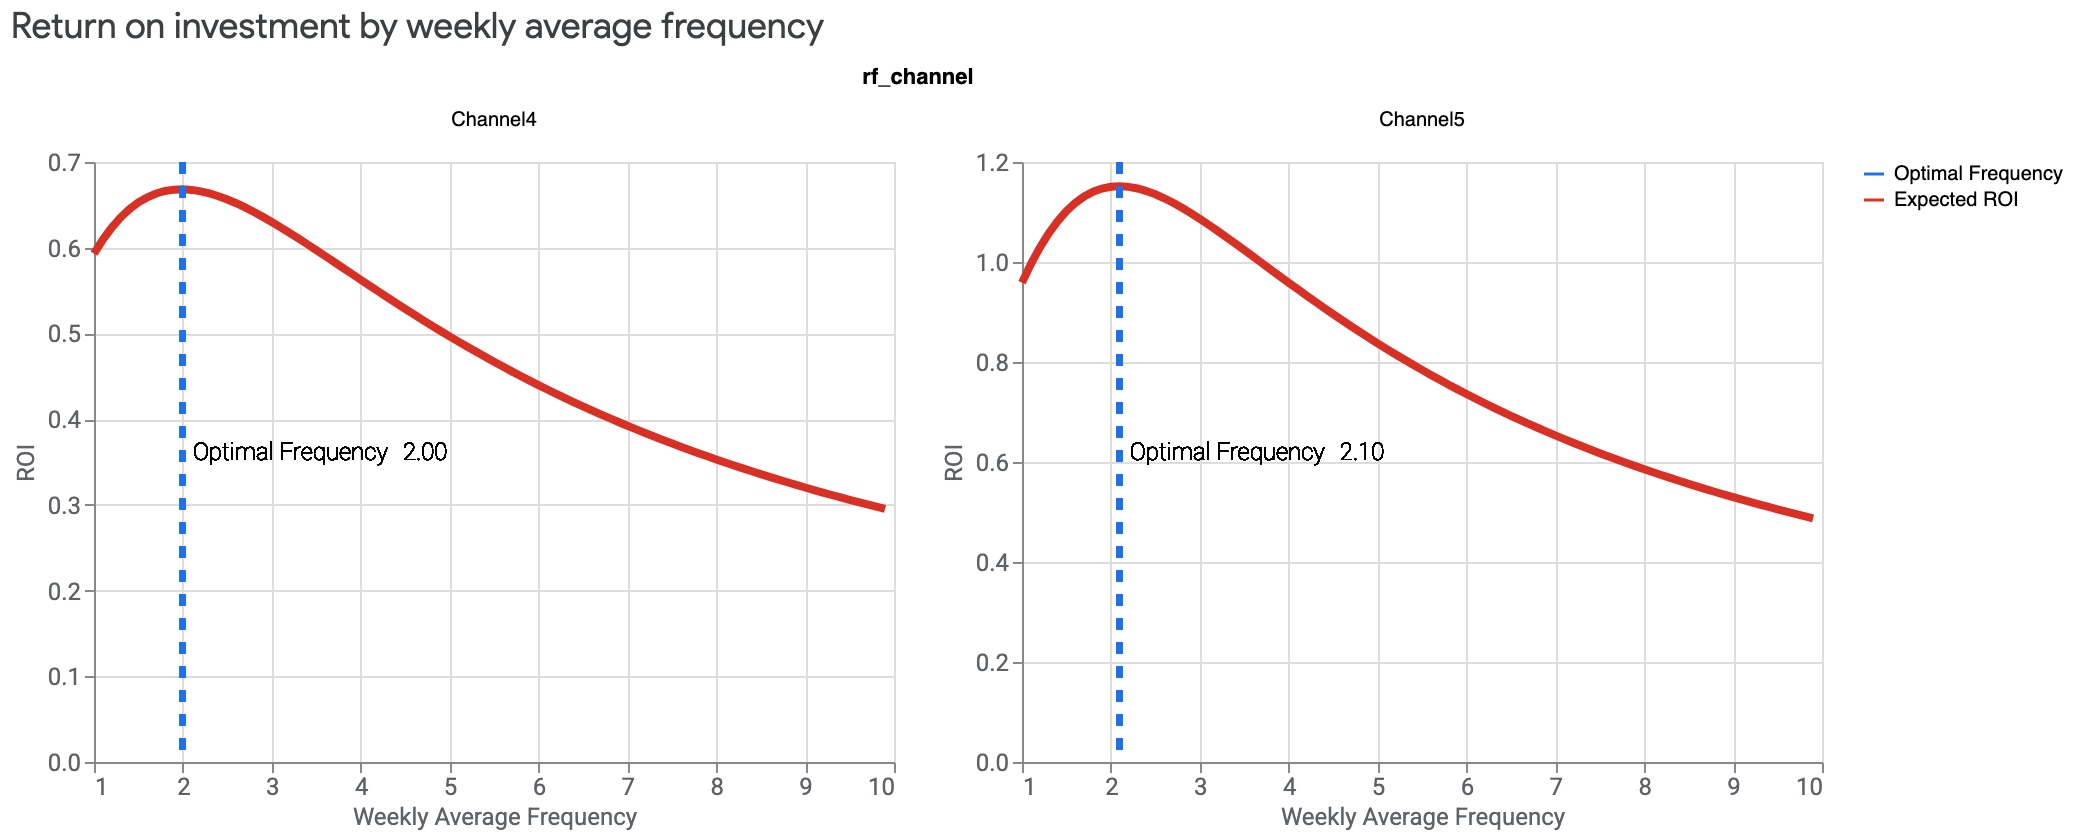
最佳频次
此图显示了投资回报率与平均频次之间的函数关系,假设此平均频次适用于所有地理位置和时间段。
最佳频次是指,为了尽可能提高投资回报率,应该在每个地理位置和时间段内向目标受众群体展示广告的平均次数。请注意,在 Meridian 模型规范中,最佳频次不依赖于预算分配。
如果您拥有一个或多个媒体渠道的覆盖面和频次数据,则可以生成最佳频次可视化图表。
以下示例显示,每个渠道的最佳频次分别为 2 和 2.1,并且渠道 5 的预期投资回报率要高得多。
(点击图片可放大。)