生成优化输出的方法有好几种。您可以:
生成可自定义时间范围的双页 HTML 优化报告,并将该 HTML 输出导出到您的 Google 云端硬盘,以便与团队共享。
生成优化结果摘要,从而自定义自己的报告、可视化图表,或将这些内容导出为其他格式。借助这些有关您的媒体指标的数值摘要,您可以了解更多详细信息。
您还可以绘制优化可视化图表。如需了解详情,请参阅绘制优化可视化图表。
生成 HTML 优化报告
运行以下代码,生成 HTML 优化报告:
如果您使用的是 Colab,并希望将报告导出到 Google 云端硬盘,请在您的 Colab 笔记本上装载 Google 云端硬盘:
from google.colab import drive
drive.mount('/content/drive')
实例化
BudgetOptimizer类并运行optimize()方法。您还可以按照前面部分中所述自定义优化。budget_optimizer = optimizer.BudgetOptimizer(mmm) optimization_results = budget_optimizer.optimize()将文件名和路径传递给
output_model_results_summary,从而运行优化摘要并将其保存到指定的文件中。示例:
filepath = '/content/drive/MyDrive'
optimization_results.output_optimization_summary(f'{FILENAME}.html', filepath)
其中:
filepath是要将该文件保存到的 Google 云端硬盘路径。FILENAME是您要为该文件指定的名称,例如optimization_output.html。文件扩展名必须为 HTML。
系统会生成 HTML 报告并将其保存到指定的文件位置。
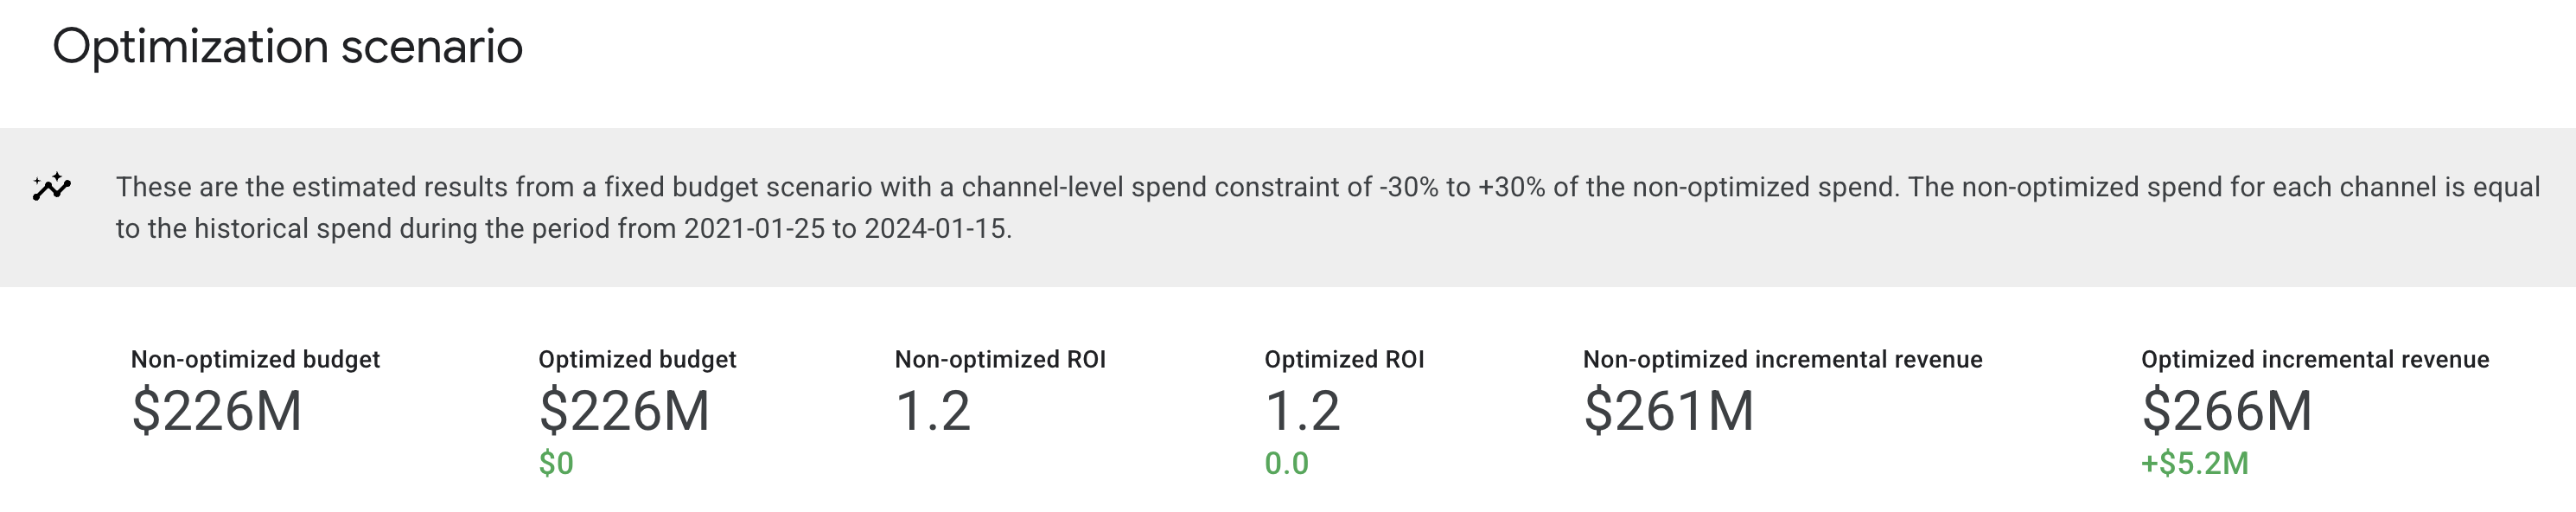
优化方案计划
优化方案计划部分显示了优化后的预算、投资回报率以及增量收入或 KPI。此外,此部分还介绍了渠道层面的支出限制以及预算优化的基准时间段。
输出示例:(点击图片可放大。)
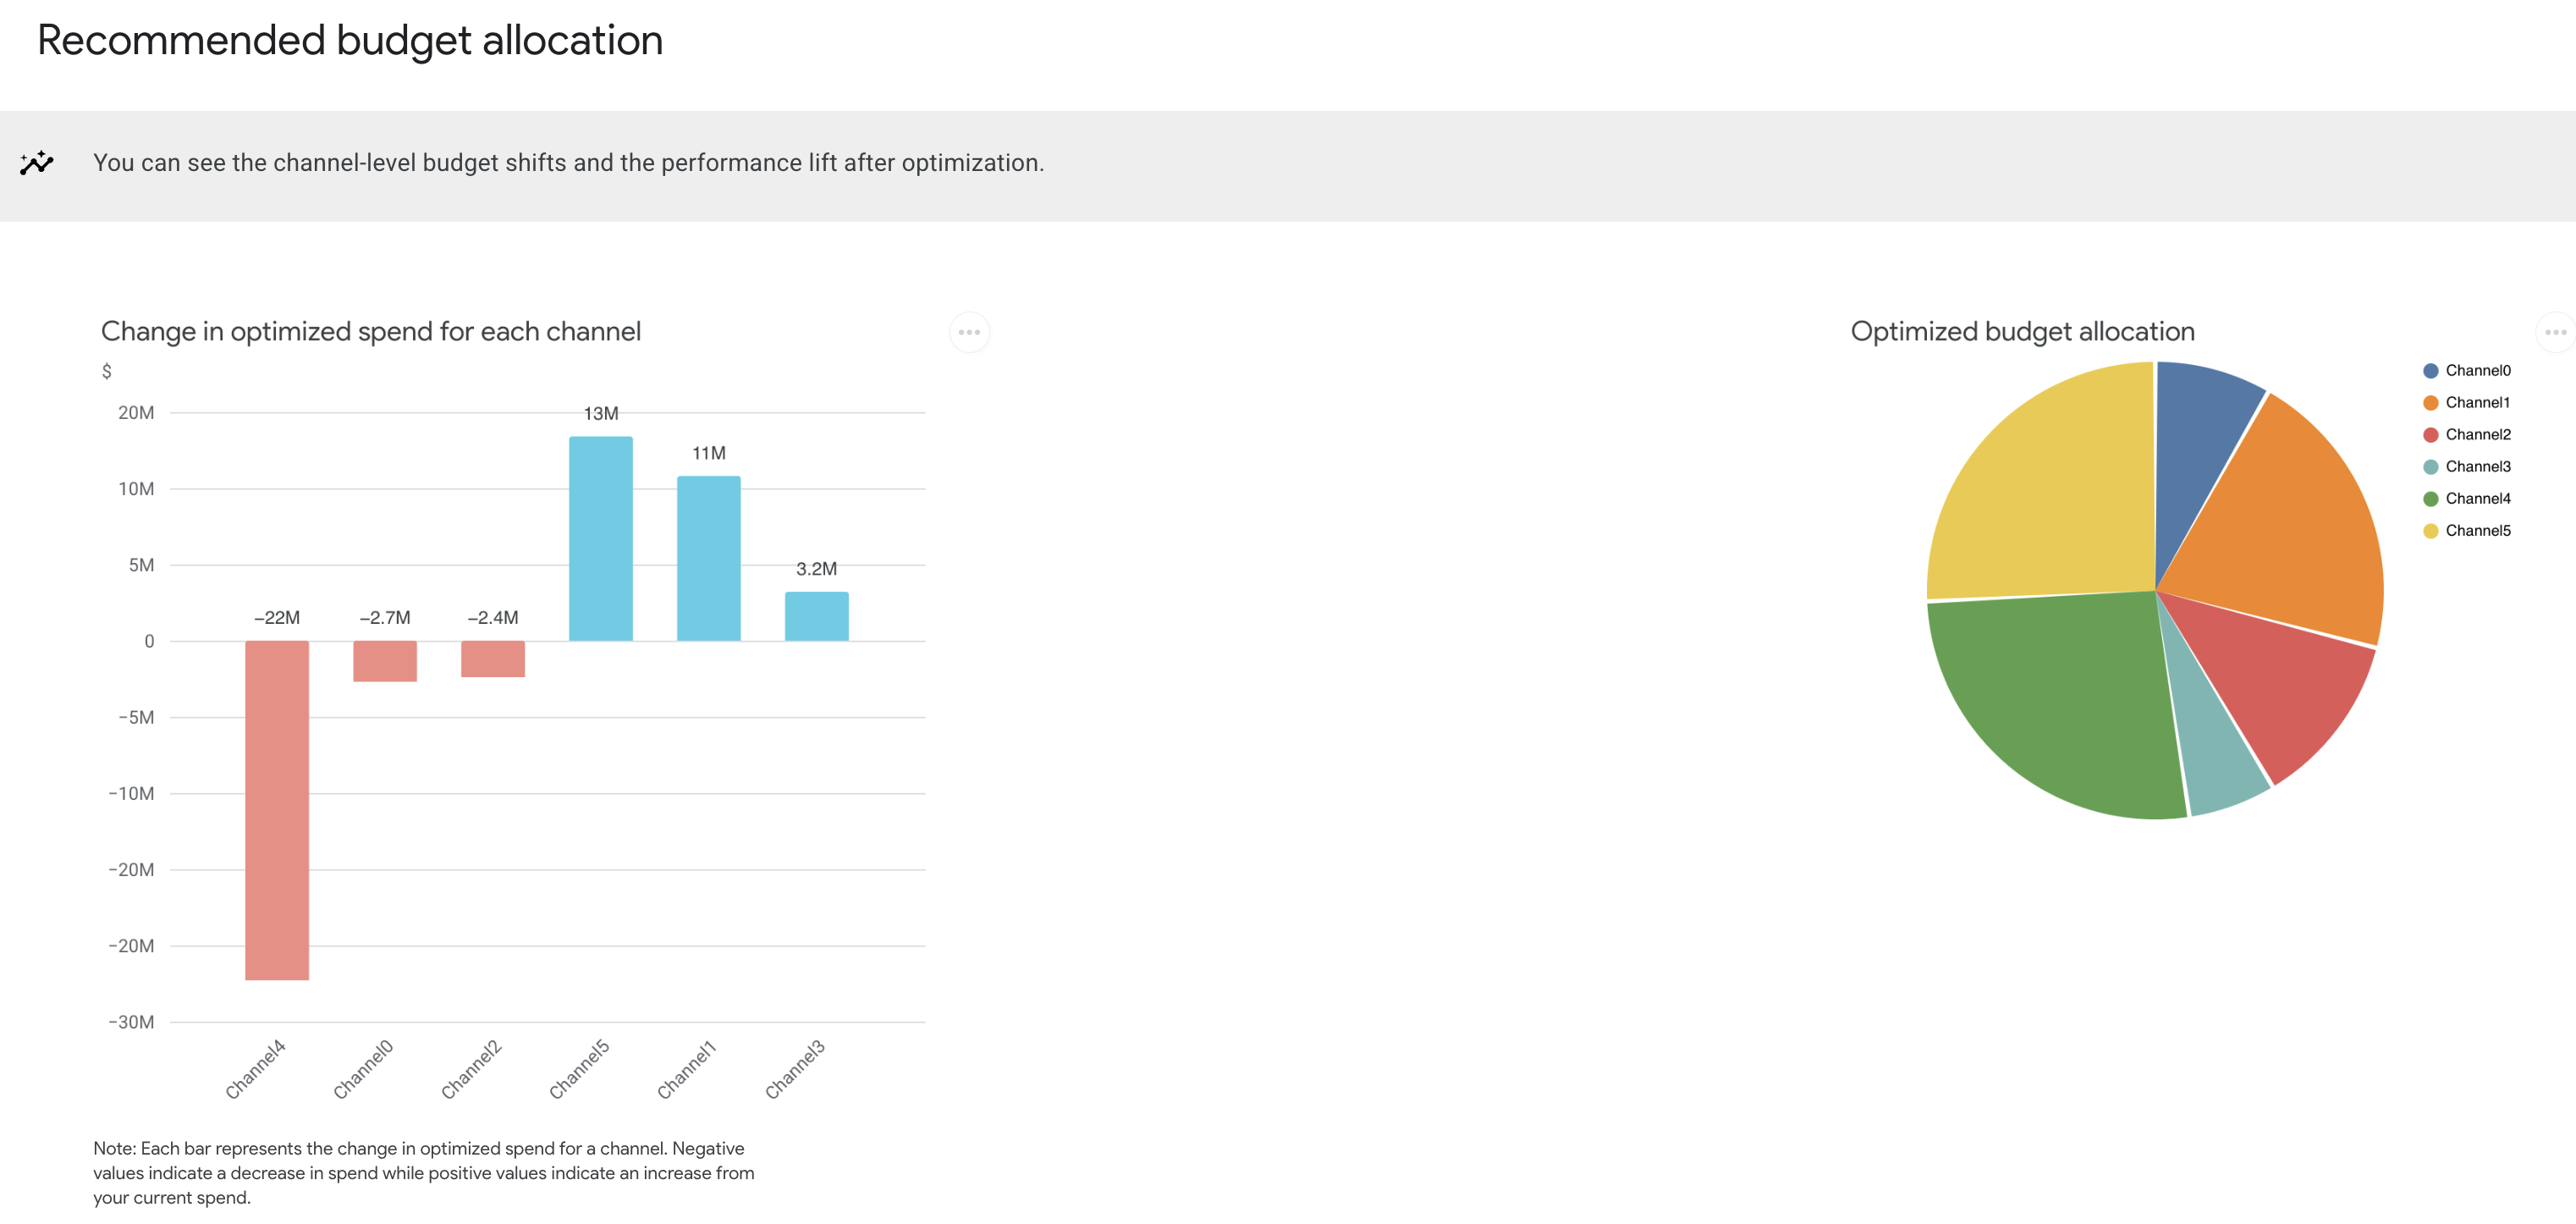
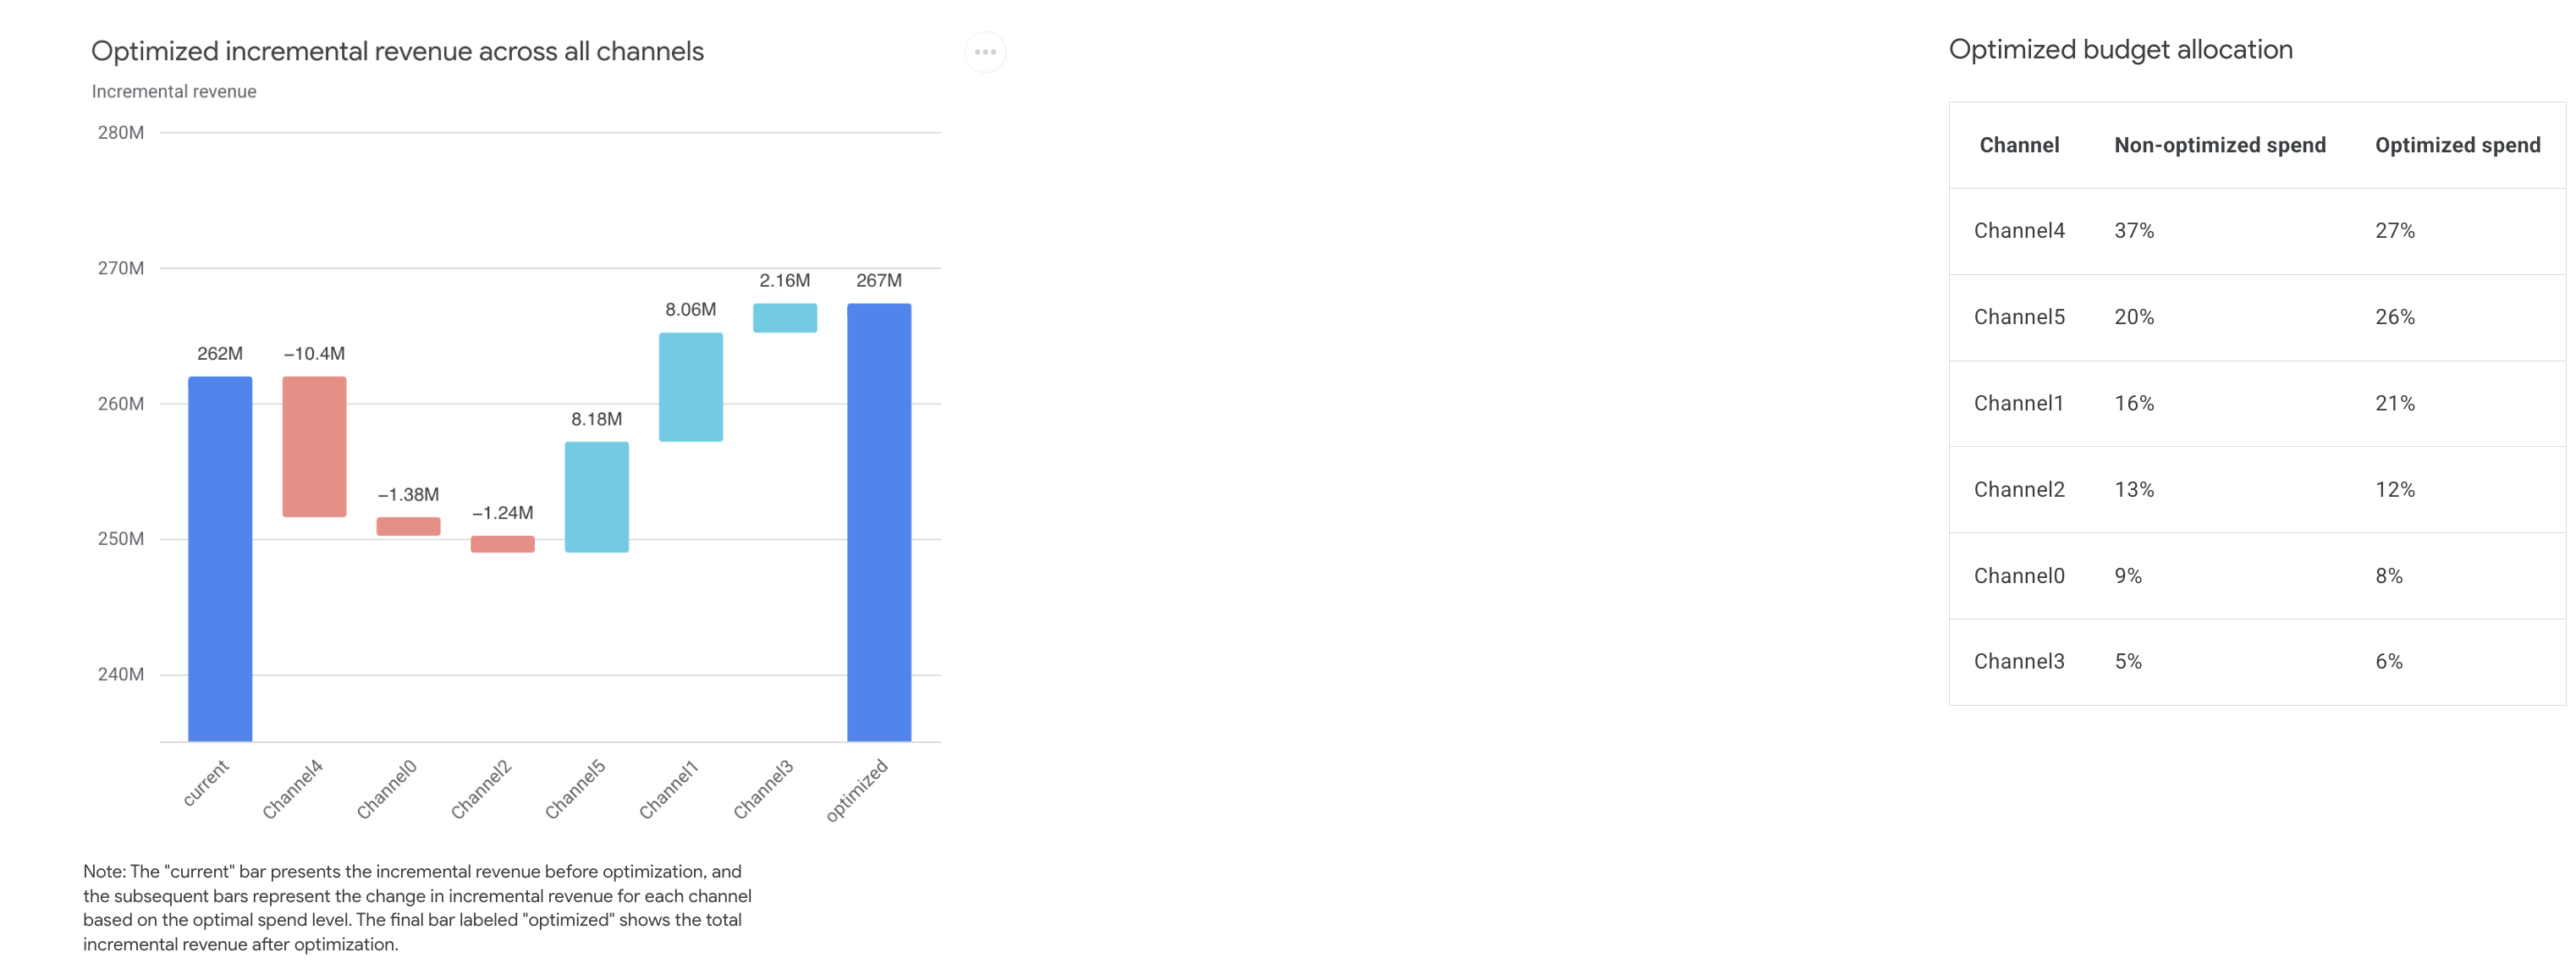
建议的预算分配
建议的预算分配图表显示了各渠道优化后支出的变化情况。此部分还显示了每个渠道从当前支出到优化后支出的增量收入或 KPI 差距。
输出示例:(点击图片可放大。)
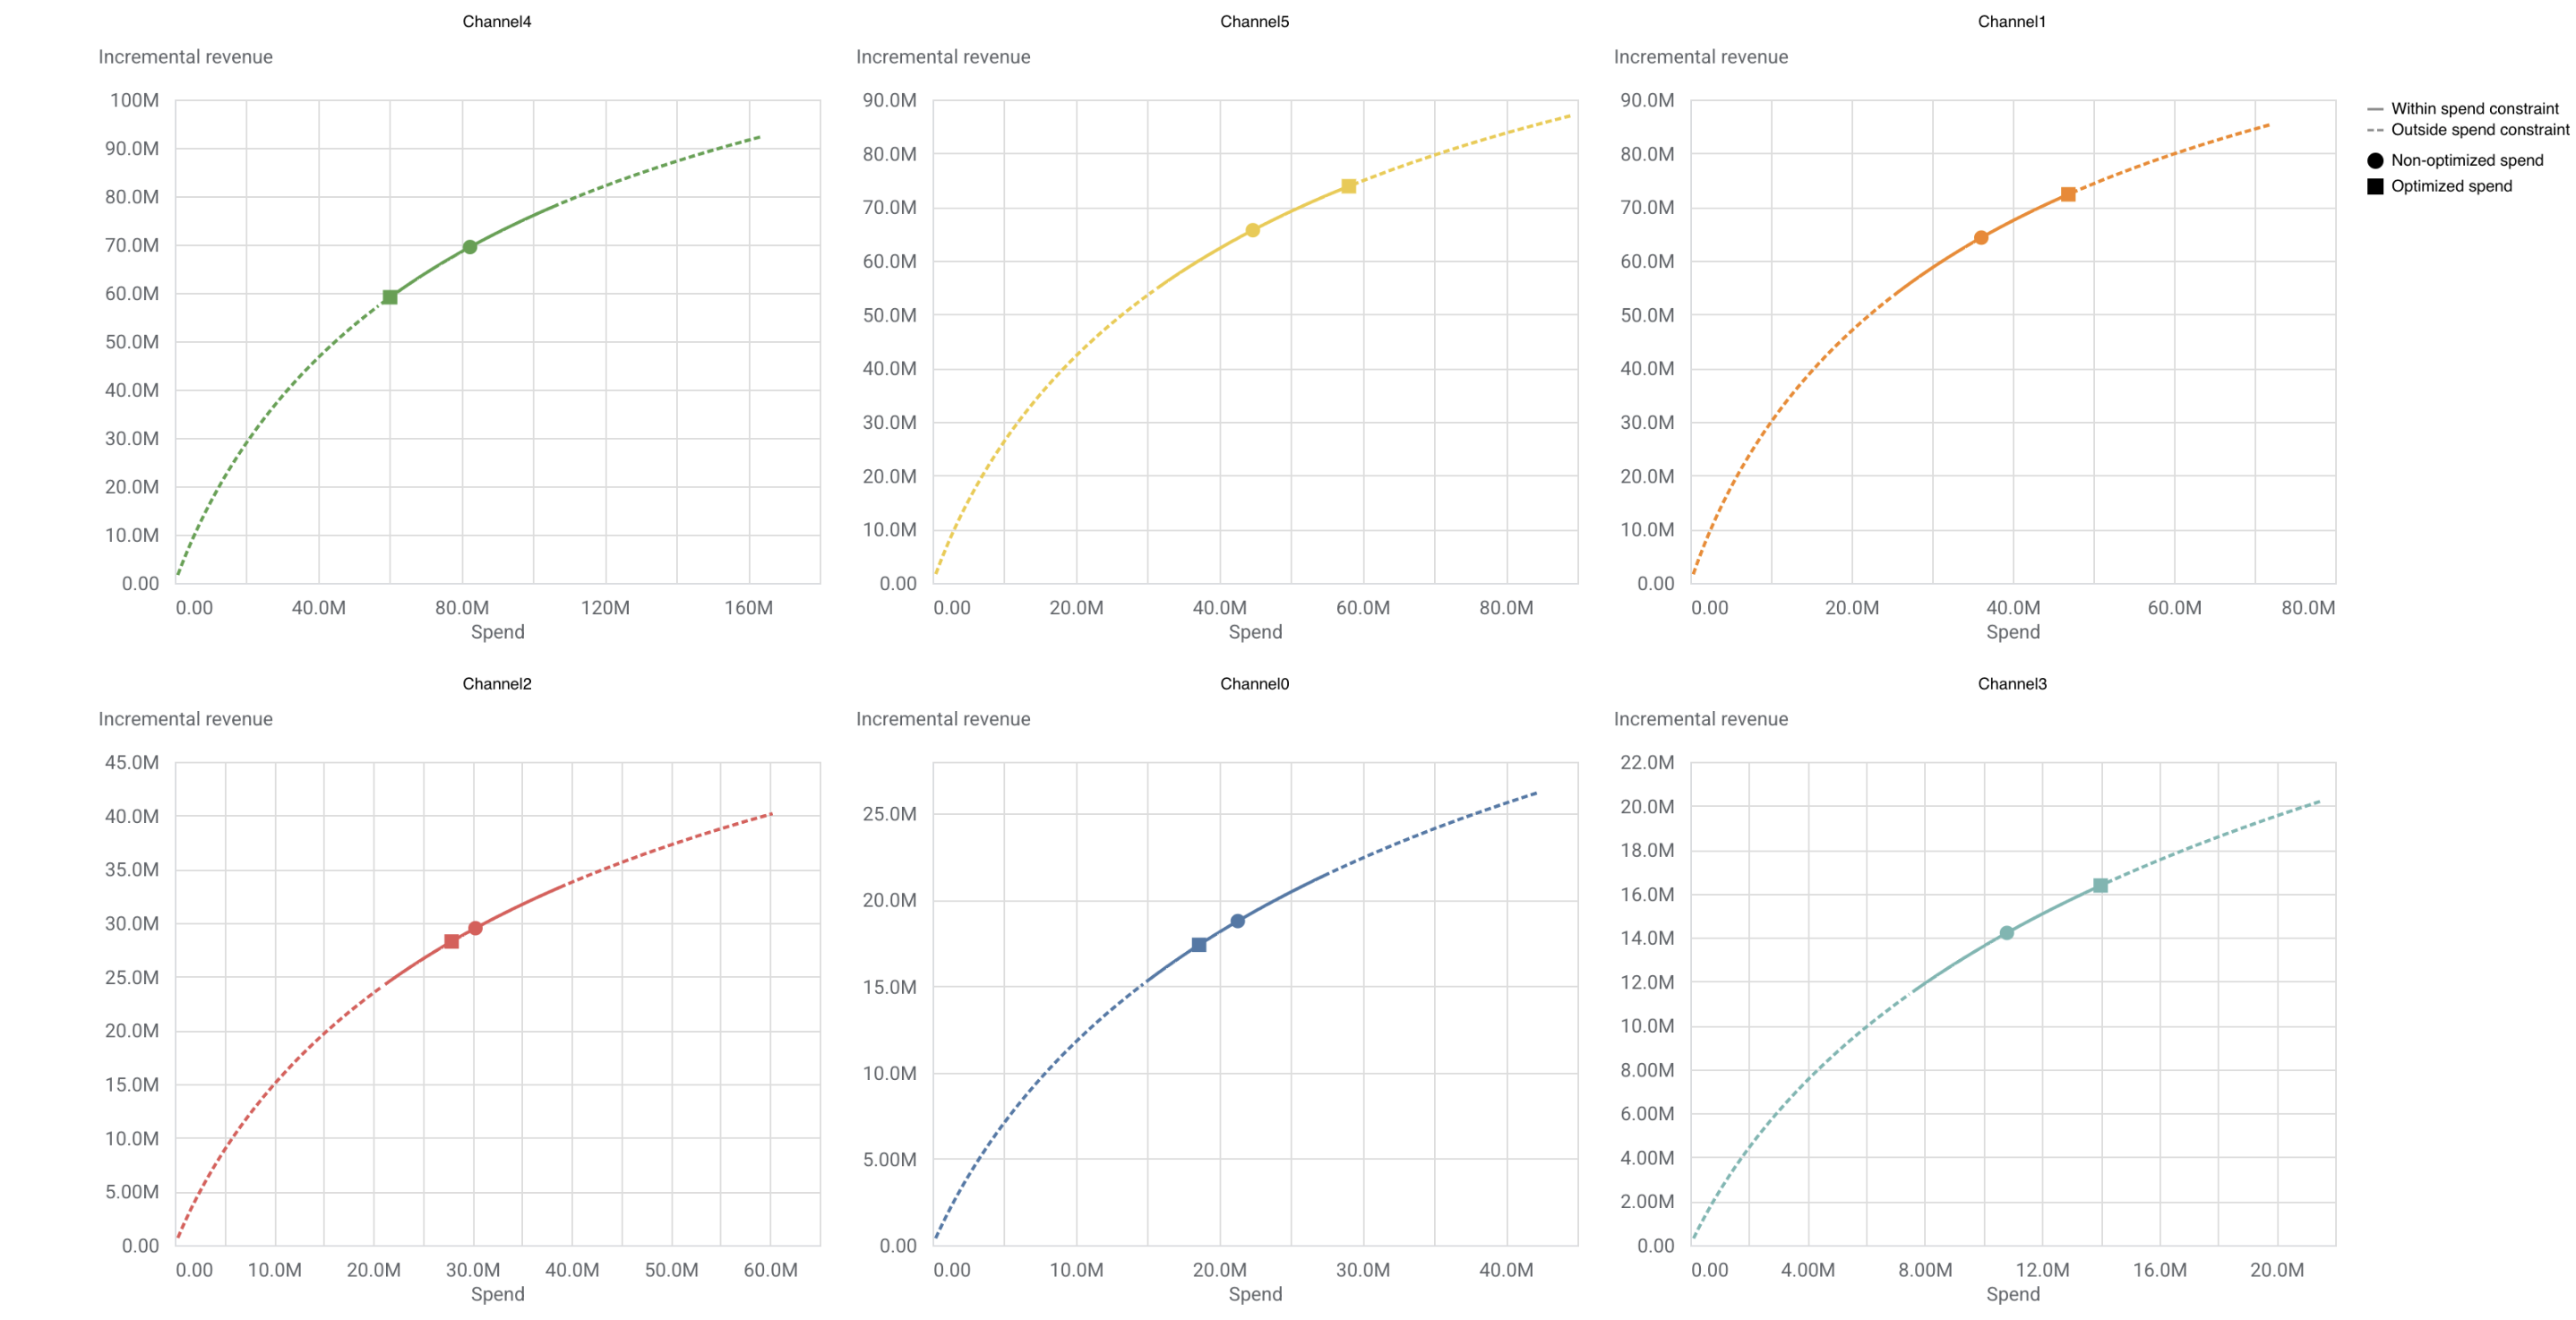
按渠道划分的优化后响应曲线
按渠道划分的优化后响应曲线部分会在响应曲线上显示您当前和优化后的渠道级支出水平。
输出示例:(点击图片可放大。)
生成优化结果摘要
您可以生成未优化的数据摘要和优化后的数据摘要,从而自定义自己的报告、可视化图表,或将这些内容导出为其他格式。这些数值摘要更加详细,按渠道对结果进行了细分,便于比较优化后的结果和未优化的结果。
您可以在 optimize() 方法返回的 OptimizationResults 数据类容器中找到这些数据摘要。
未优化的摘要
运行以下命令,生成未优化的数据摘要:
optimization_results.nonoptimized_data
输出示例:
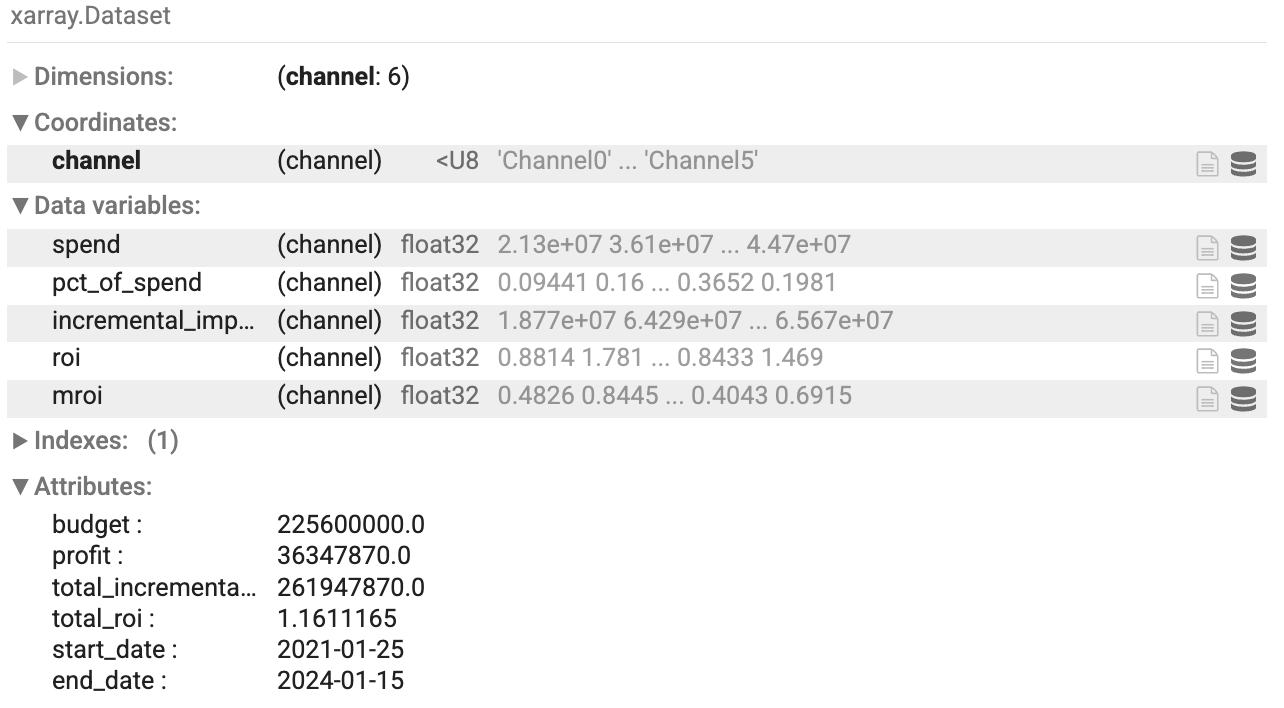
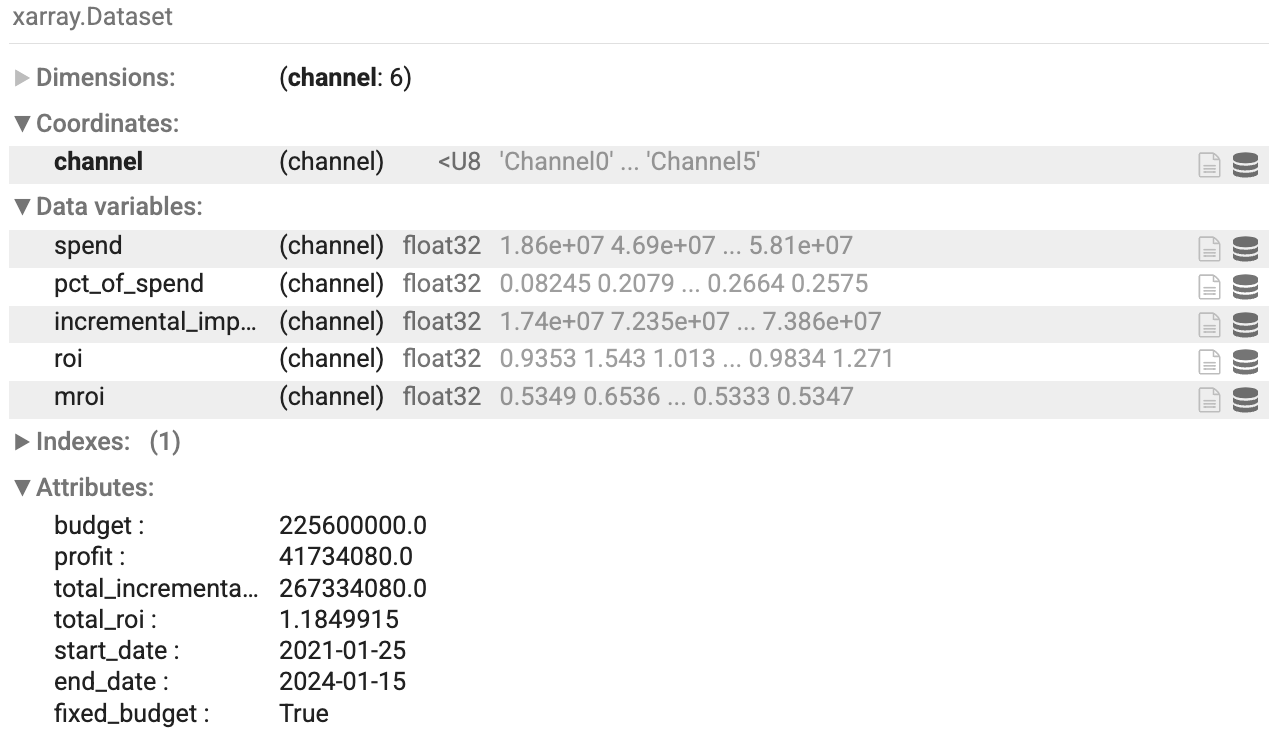
优化后的摘要
运行以下命令,生成优化后的数据摘要:
optimization_results.optimized_data
输出示例: