モデルの出力結果を生成するには、次の複数の方法があります。
カスタムの期間を指定して 2 ページの HTML レポートを生成し、その HTML 出力を Google ドライブにエクスポートしてチームと共有します。
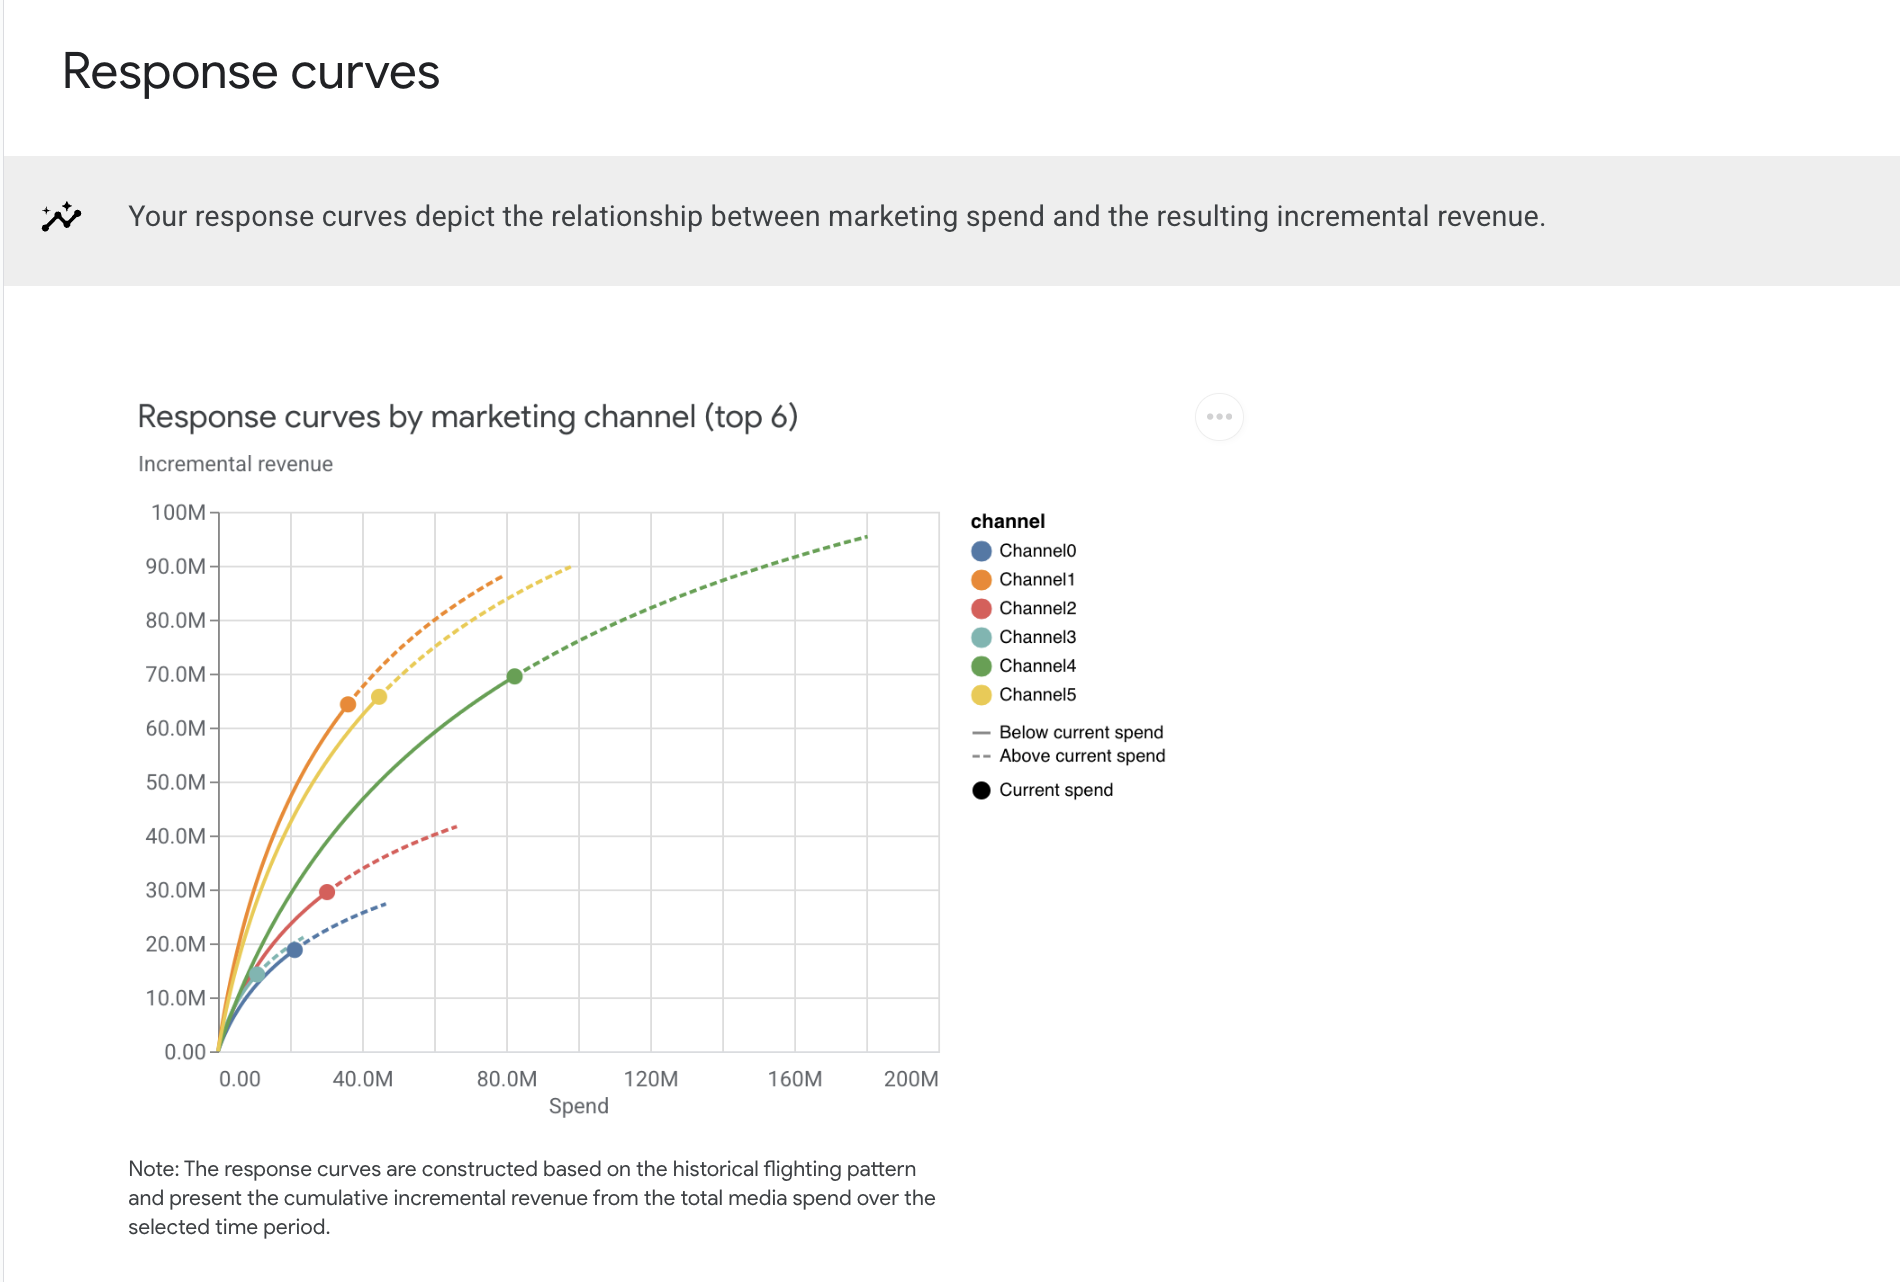
モデルの結果の概要を生成して、レポートや可視化データをカスタマイズしたり、別の形式にエクスポートしたりできます。こうしたメディア指標の数値の概要から、詳細を確認できます。
メディアのデータをプロットして可視化することもできます。詳しくは、メディアのデータをプロットして可視化する方法をご確認ください。
モデルの結果の HTML レポートを生成する
モデルの結果のレポートを生成してエクスポートする手順は次のとおりです。
Colab を使用してレポートを Google ドライブにエクスポートする場合は、Google ドライブを Colab ノートブックにマウントします。
from google.colab import drive
drive.mount('/content/drive')
メリディアン モデル オブジェクトを使用して
Summarizerクラスを初期化します。summarizer = summarizer.Summarizer(mmm)ファイル名、パス、開始日、終了日を
output_model_results_summaryに渡して、その期間の概要を作成し、指定したファイルに保存します。例:
filepath = '/content/drive/MyDrive'
start_date = '2020-01-05'
end_date = '2020-12-27'
summarizer.output_model_results_summary(f'{FILENAME}.html',
                                        filepath,
                                        start_date,
                                        end_date)
ここで
filepathは、ファイルを保存する Google ドライブ内のパスです。start_dateは、レポートの開始日(yyyy-mm-dd 形式)です。end_dateは、レポートの終了日(yyyy-mm-dd 形式)です。FILENAMEは、ファイルに指定する名前(例:summary_output.html)です。ファイルの拡張子は HTML にする必要があります。
HTML レポートが生成され、指定したファイルの場所に保存されます。
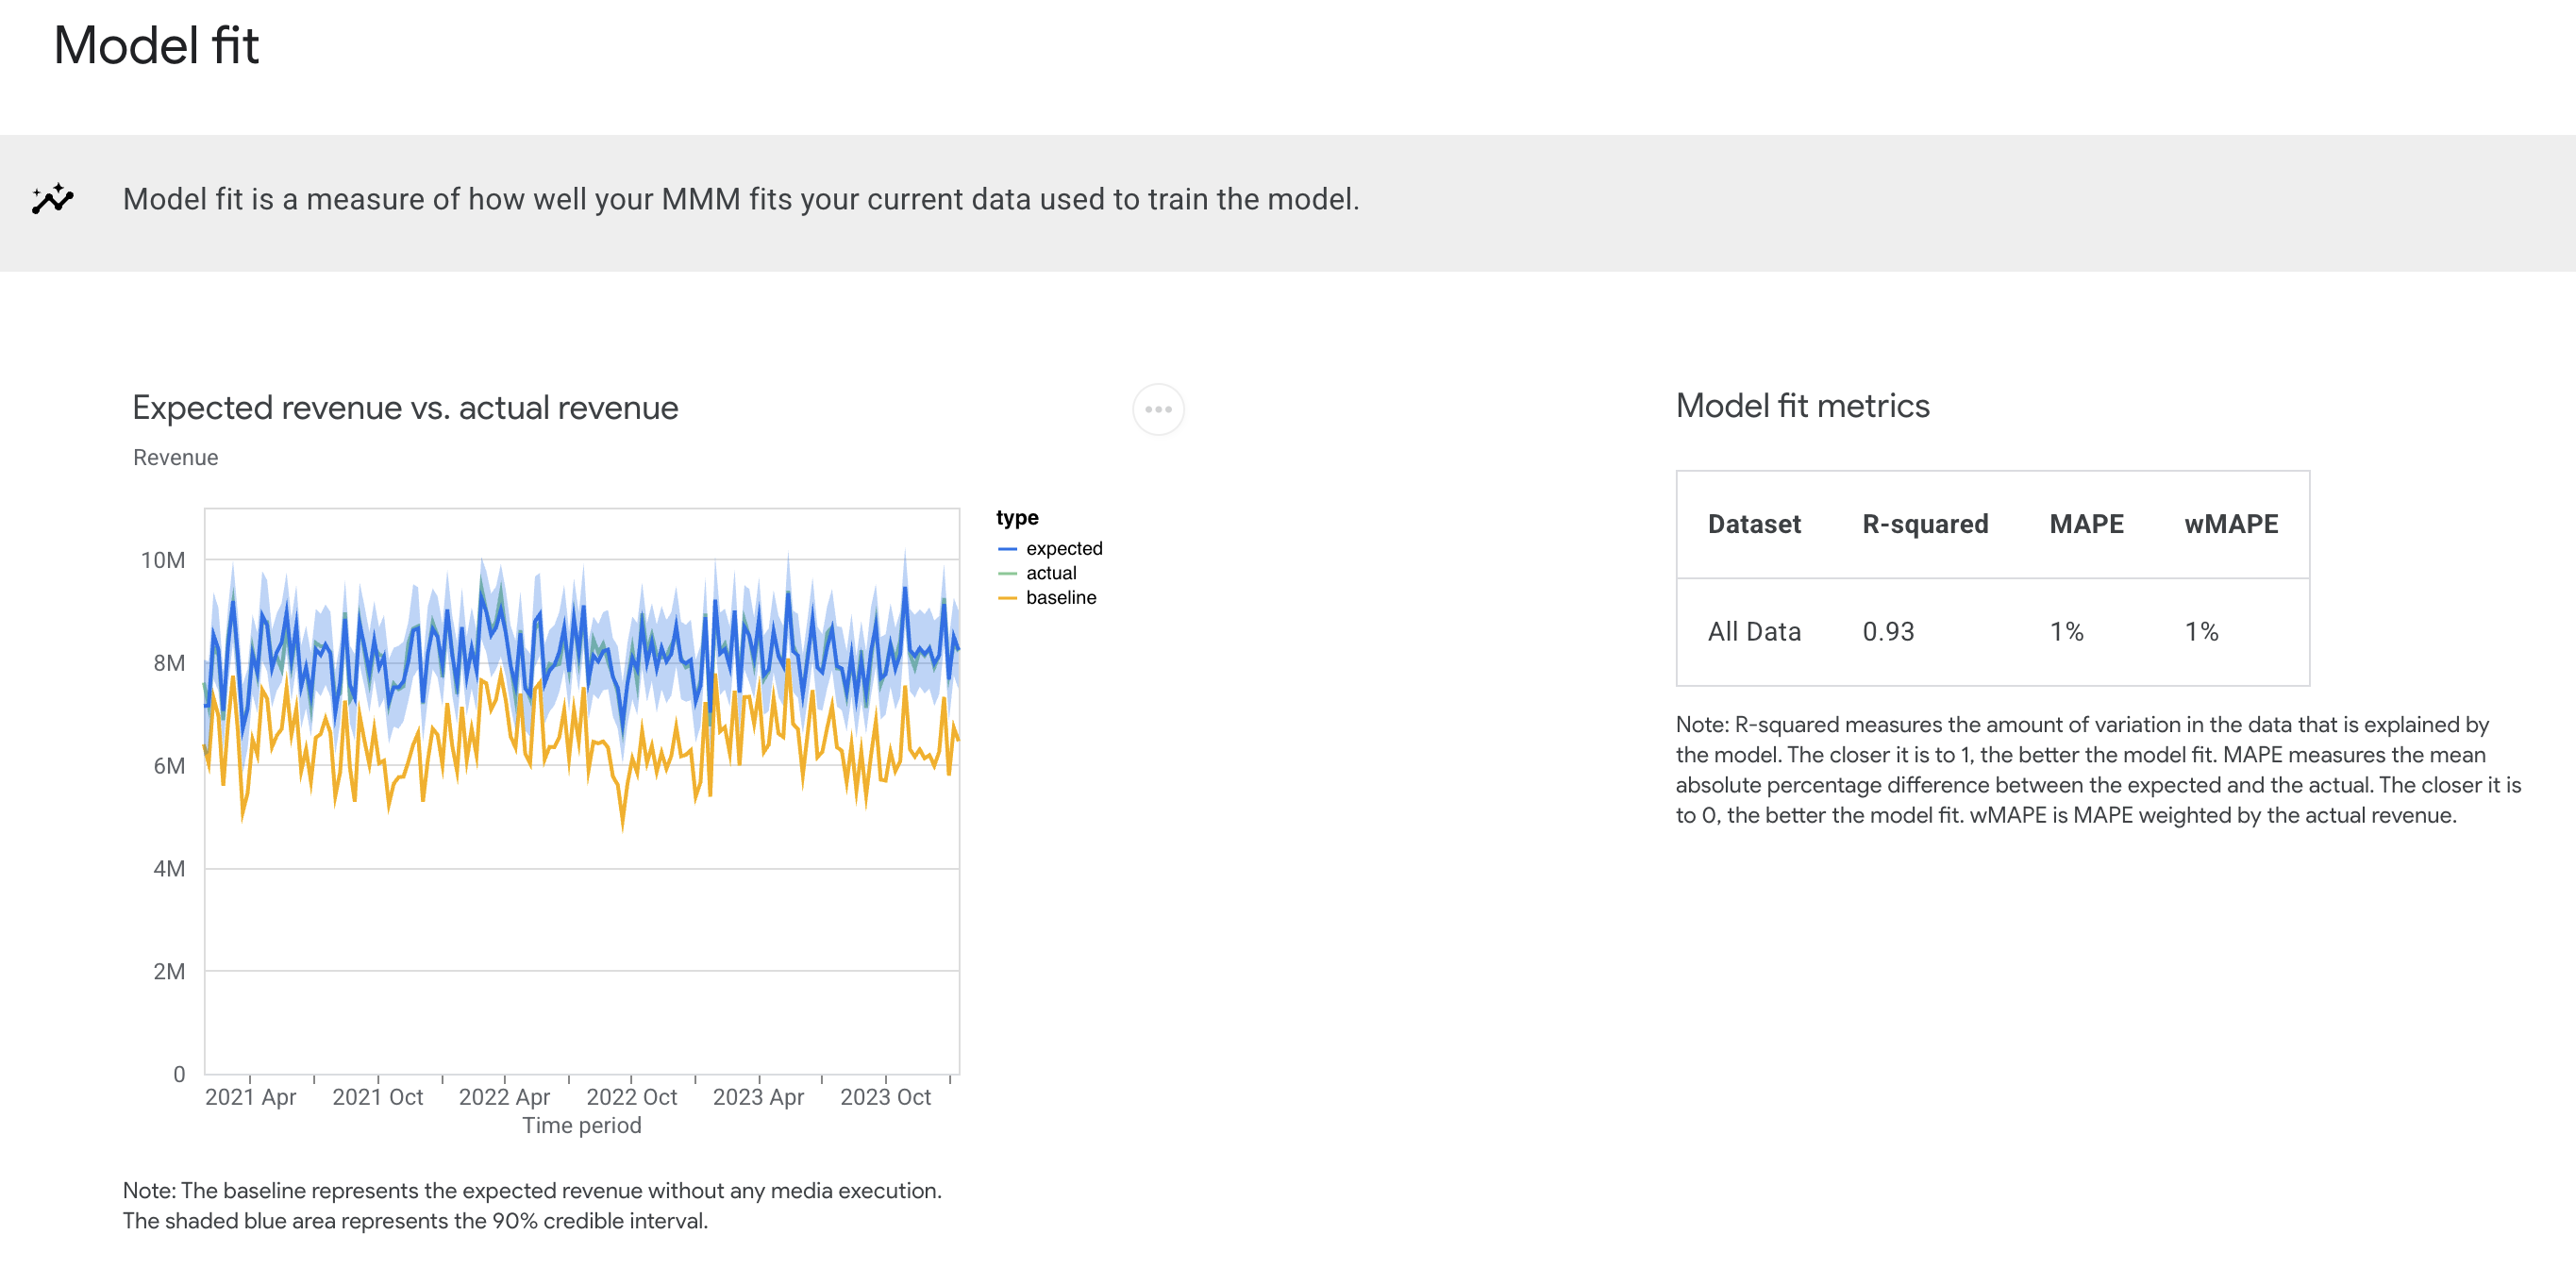
モデルの適合度
モデルの適合度のセクションでは、適合度の統計データをチェックできます。メリディアンでは、決定係数、平均絶対誤差率(MAPE)、加重平均絶対誤差率(wMAPE)などのモデル適合度の統計データを確認できます。また、メリディアンでは、収益(または KPI)の実測値と予測値を比較できる視覚的なデータも確認できます。こうしたプロットがあると、モデルのパフォーマンスや、モデルが過小適合かどうかを判断しやすくなります。
モデル適合度の統計データは、モデル候補の比較にも役立ちます。ただし、適合度指標から、モデルが因果推論にどの程度適しているかが完全にわかるわけではありません。また、因果推論に最適なモデルが、予測に最適なモデルとは異なる可能性もあります。
モデルの適合度評価については、モデル診断をご確認ください。
出力例:(画像をクリックして拡大)
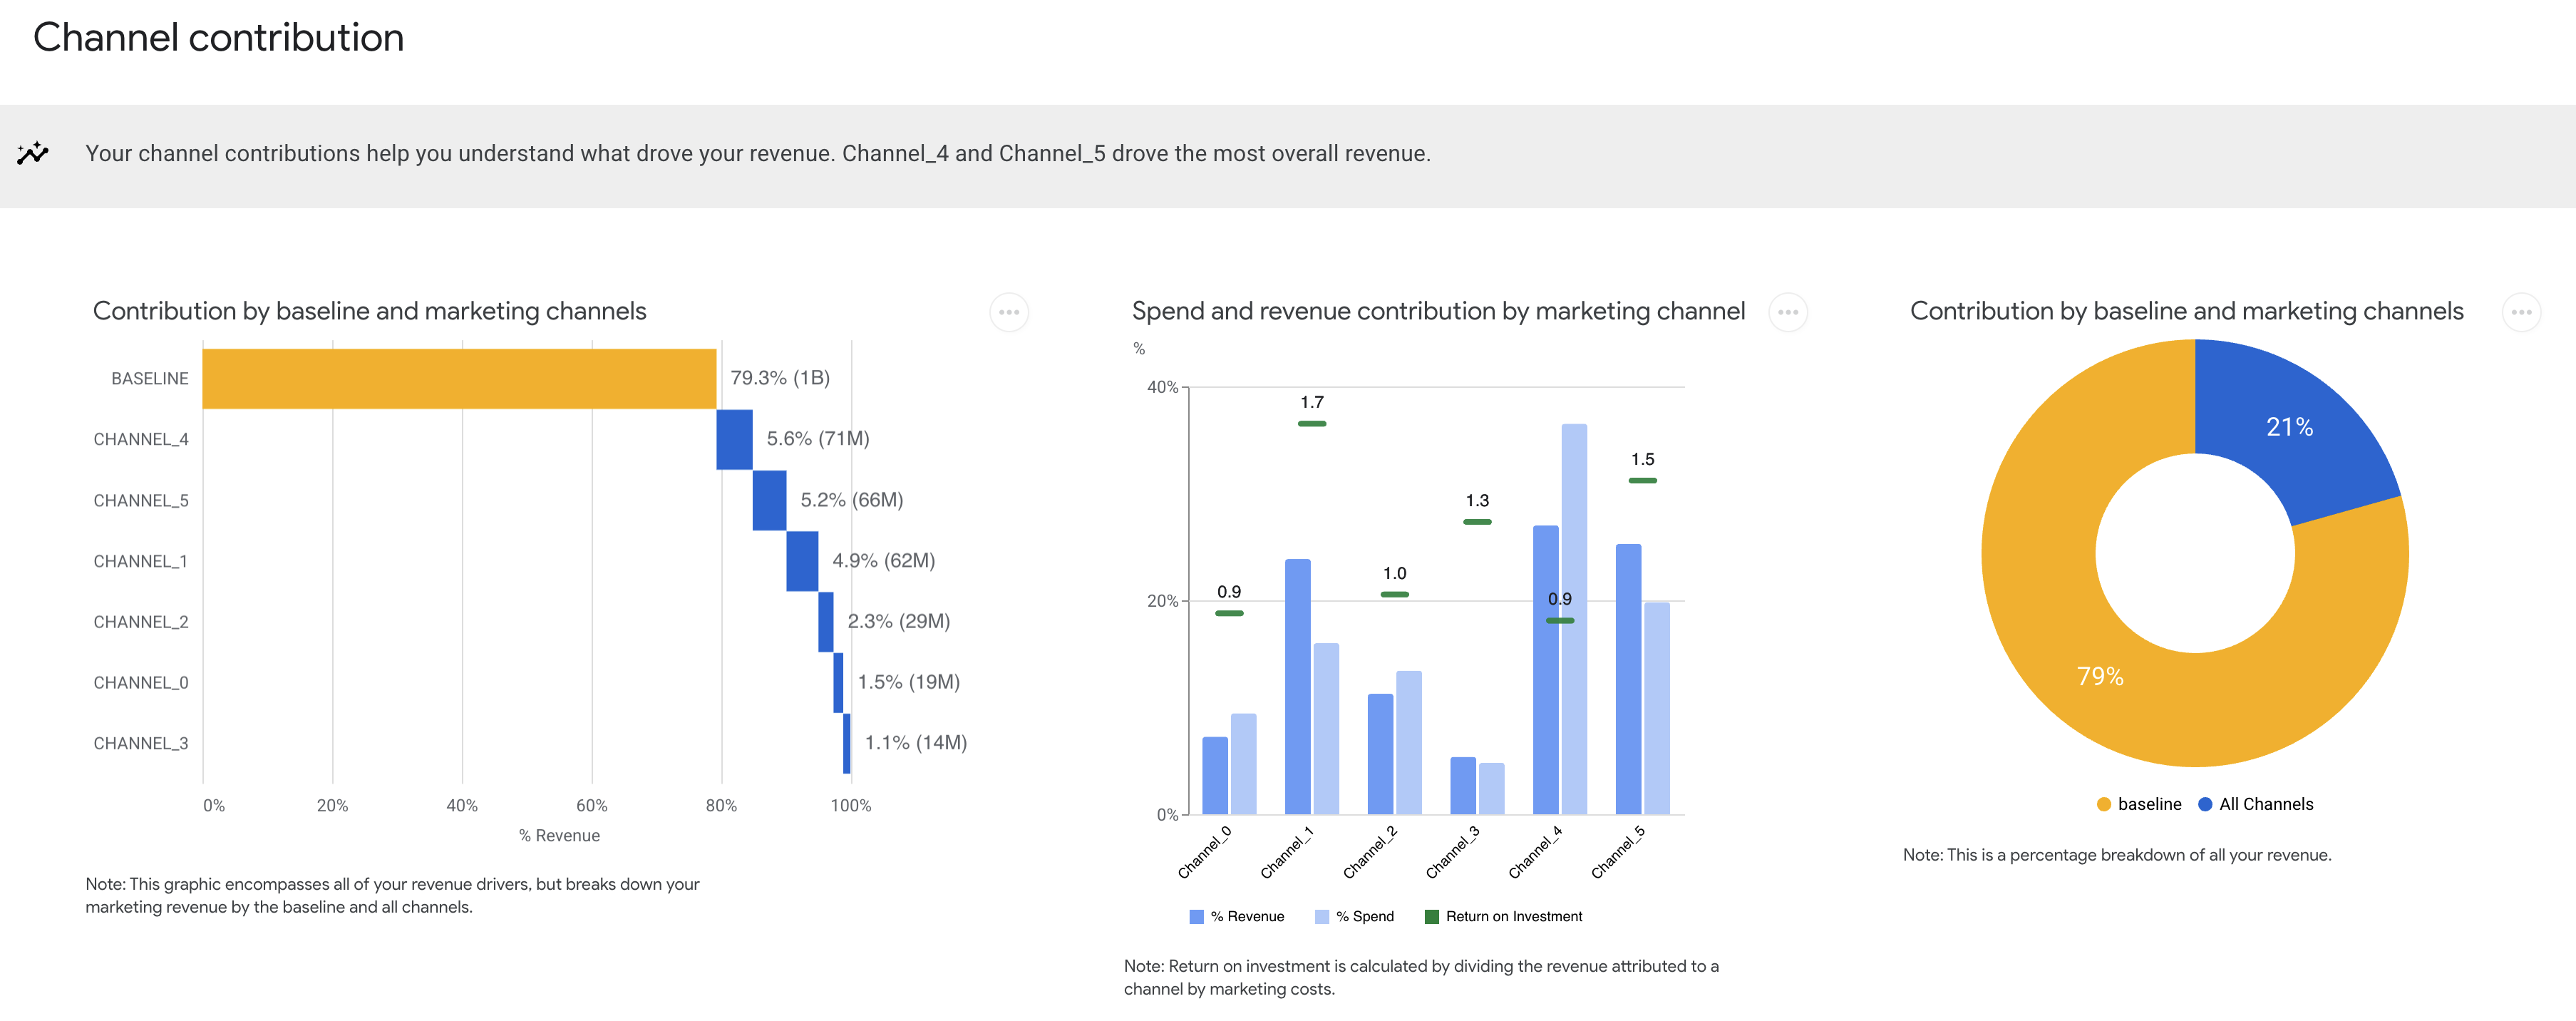
収益または KPI への貢献度
収益または KPI への貢献度のセクションには、メディアおよびメディア以外のアクティビティが、収益または KPI のパフォーマンスにどの程度の効果を与えたのかを分析したデータが表示されます。さまざまなチャネル間で、費用対効果(ROI)、費用の割合、収益や KPI の増分などの主要指標を比較できます。また、このセクションでは、ベースライン、価格設定、プロモーション、さまざまなマーケティング チャネル別に貢献度を分類できます。
出力例:(画像をクリックして拡大)
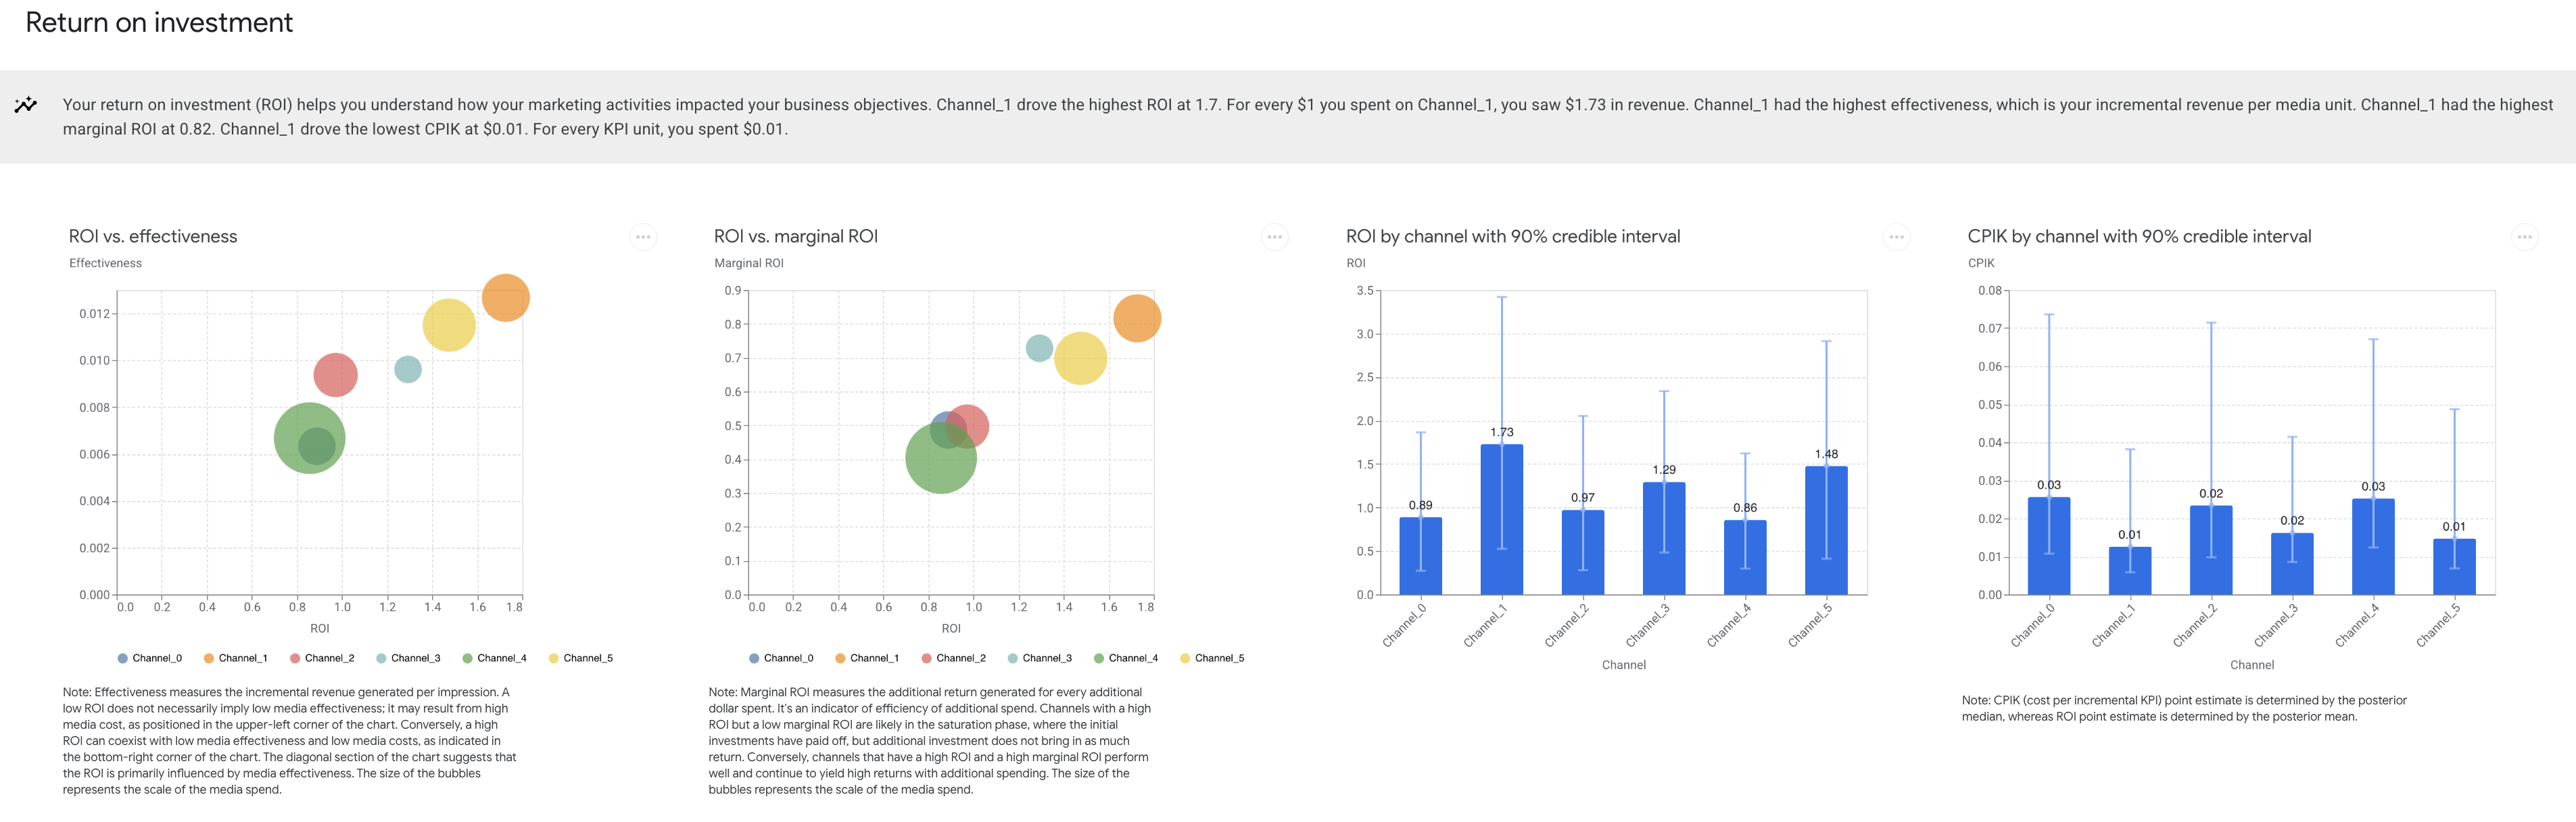
費用対効果
費用対効果のセクションでは、チャネルの費用対効果を詳細に分析して、パフォーマンスの高いチャネルを特定できます。各チャネルの費用対効果、限界費用対効果、有効性を比較できます。また、このセクションでは、費用対効果の推定値の信頼区間も確認できます、これはベイズ モデルの利点の 1 つです。
出力例:(画像をクリックして拡大)
最適化分析
最適化分析のセクションには、現在の費用レベルと、チャネルごとの限界費用対効果が低下し始めるポイントが表示されます。また、翌年の予算配分を決める際に役立つ、フリークエンシーの最適化案も確認できます。
出力例:
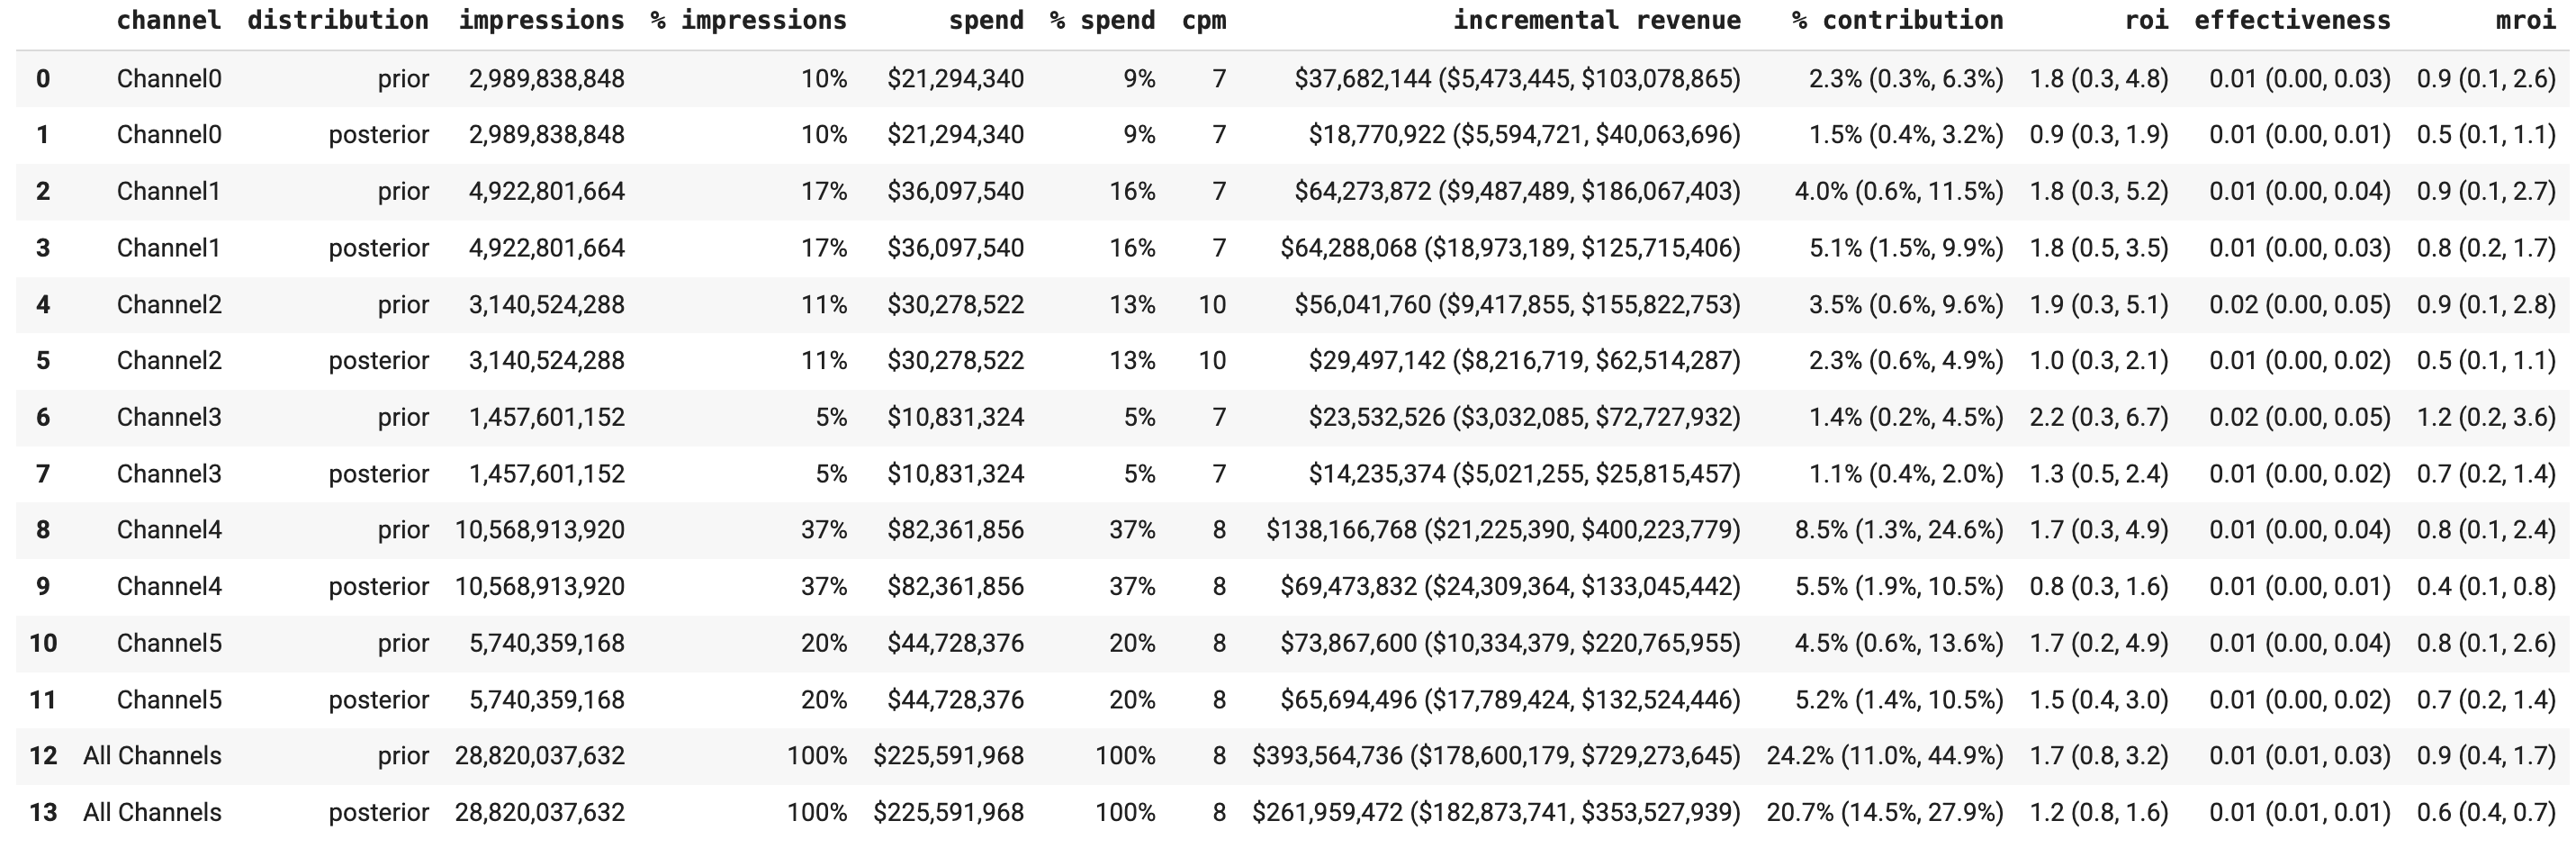
モデルの結果の概要を生成する
モデルの結果の概要は、MediaSummary クラスによって生成されます。このクラスを初期化するときに、モデル結果の信頼区間は confidence_level 引数を使用して指定できます。モデルの推定期間については、selected_times 引数を使用して指定できます。デフォルトでは、90% の信頼区間と完全なモデリング ウィンドウを使用して、統計情報の概要が生成されます。
例:
デフォルト設定で概要を生成する場合は、次のコマンドを実行します。
media_summary = visualizer.MediaSummary(mmm)
media_summary.summary_table()
出力例:(画像をクリックして拡大)