Page Summary
-
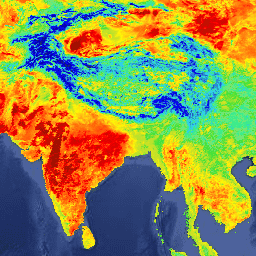
The MOD21A1D dataset provides daily land surface temperature (LST) and 3-band emissivity data at a 1000-meter spatial resolution.
-
Data is available from February 24, 2000, to October 14, 2025, with a daily cadence.
-
The dataset is produced by NASA LP DAAC at the USGS EROS Center and has no restrictions on use, sale, or redistribution.
-
Key bands include Land Surface Temperature, Quality Control information, and emissivity for bands 29, 31, and 32.
- Dataset Availability
- 2000-02-24T00:00:00Z–2026-07-20T00:00:00Z
- Dataset Producer
- NASA LP DAAC at the USGS EROS Center
- Cadence
- 1 Day
- Tags
Description
The MOD21A1D dataset is produced daily from daytime Level 2 Gridded (L2G) intermediate LST products at a spatial resolution of 1,000 meters. The L2G process maps the daily MOD21 swath granules onto a sinusoidal MODIS grid and stores all observations falling over a gridded cell for a given day. The MOD21A1 algorithm sorts through these observations for each cell and estimates the final LST value as an average from all observations that are cloud free and have good LST&E accuracies. The daytime average is weighted by the observation coverage for that cell. Only observations having an observation coverage greater than a 15% threshold are considered. The MOD21A1D product contains the calculated LST as well as quality control, the three emissivity bands, view zenith angle, and time of observation.
Note that scale factors and offsets described in the MODIS documentation for MOD21A1D bands are already applied to assets ingested into Earth Engine.
Documentation:
Bands
Bands
Pixel size: 1000 meters (all bands)
| Name | Units | Min | Max | Pixel Size | Description | ||||||||||||||||||||||||||||||||||||||||||||||||||||||||||||||||||||||||||||||||||||||||||||||
|---|---|---|---|---|---|---|---|---|---|---|---|---|---|---|---|---|---|---|---|---|---|---|---|---|---|---|---|---|---|---|---|---|---|---|---|---|---|---|---|---|---|---|---|---|---|---|---|---|---|---|---|---|---|---|---|---|---|---|---|---|---|---|---|---|---|---|---|---|---|---|---|---|---|---|---|---|---|---|---|---|---|---|---|---|---|---|---|---|---|---|---|---|---|---|---|---|---|---|---|
LST_1KM |
K | 7500 | 65535 | 1000 meters | Land Surface Temperature |
||||||||||||||||||||||||||||||||||||||||||||||||||||||||||||||||||||||||||||||||||||||||||||||
QC |
1000 meters | Quality Control |
|||||||||||||||||||||||||||||||||||||||||||||||||||||||||||||||||||||||||||||||||||||||||||||||||
Emis_29 |
0 | 255 | 1000 meters | Band 29 emissivity |
|||||||||||||||||||||||||||||||||||||||||||||||||||||||||||||||||||||||||||||||||||||||||||||||
Emis_31 |
1 | 255 | 1000 meters | Band 31 emissivity |
|||||||||||||||||||||||||||||||||||||||||||||||||||||||||||||||||||||||||||||||||||||||||||||||
Emis_32 |
1 | 255 | 1000 meters | Band 32 emissivity |
|||||||||||||||||||||||||||||||||||||||||||||||||||||||||||||||||||||||||||||||||||||||||||||||
View_Angle |
deg | 0 | 130 | 1000 meters | MODIS view zenith angle |
||||||||||||||||||||||||||||||||||||||||||||||||||||||||||||||||||||||||||||||||||||||||||||||
View_Time |
h | 0 | 240 | 1000 meters | Time of MODIS observation |
||||||||||||||||||||||||||||||||||||||||||||||||||||||||||||||||||||||||||||||||||||||||||||||
Terms of Use
Terms of Use
MODIS data and products acquired through the LP DAAC have no restrictions on subsequent use, sale, or redistribution.
Citations
Please visit LP DAAC 'Citing Our Data' page for information on citing LP DAAC datasets.
DOIs
Explore with Earth Engine
Code Editor (JavaScript)
var dataset = ee.ImageCollection('MODIS/061/MOD21A1D')
                  .filter(ee.Filter.date('2018-01-01', '2018-05-01'));
var landSurfaceTemperature = dataset.select('LST_1KM');
var landSurfaceTemperatureVis = {
  min: 216.0,
  max: 348.0,
  palette: [
    '040274', '040281', '0502a3', '0502b8', '0502ce', '0502e6',
    '0602ff', '235cb1', '307ef3', '269db1', '30c8e2', '32d3ef',
    '3be285', '3ff38f', '86e26f', '3ae237', 'b5e22e', 'd6e21f',
    'fff705', 'ffd611', 'ffb613', 'ff8b13', 'ff6e08', 'ff500d',
    'ff0000', 'de0101', 'c21301', 'a71001', '911003'
  ],
};
Map.setCenter(6.746, 46.529, 2);
Map.addLayer(
    landSurfaceTemperature, landSurfaceTemperatureVis,
    'Land Surface Temperature');