- 利用可能なデータセットの期間
- 1981-01-01T00:00:00Z–2025-11-30T00:00:00Z
- データセット プロバイダ
- UCSB/CHG
- ケイデンス
- 1 日
- タグ
説明
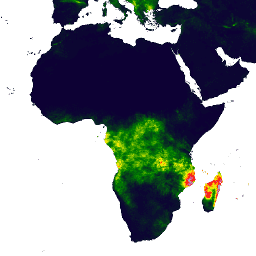
Climate Hazards Center InfraRed Precipitation with Station data(CHIRPS)は、30 年以上の準グローバル降雨量データセットです。CHIRPS は、0.05° の解像度の衛星画像と現地観測所のデータを組み合わせて、傾向分析と季節的な干ばつモニタリング用の降雨量時系列データをグリッド形式で作成します。
バンド
ピクセルサイズ
5566 メートル
バンド
| 名前 | 単位 | 最小 | 最大 | ピクセルサイズ | 説明 |
|---|---|---|---|---|---|
precipitation |
mm/d | 0* | 1444.34* | メートル | 降水量 |
利用規約
利用規約
このデータセットはパブリック ドメインにあります。法律で認められる範囲で、Pete Peterson は、Climate Hazards Center Infrared Precipitation with Stations(CHIRPS)に対するすべての著作権および関連する権利または隣接権を放棄しました。
引用
Funk, Chris, Pete Peterson, Martin Landsfeld, Diego Pedreros, James Verdin, Shraddhanand Shukla, Gregory Husak, James Rowland, Laura Harrison, Andrew Hoell & Joel Michaelsen. 「The climate hazards infrared precipitation with stations-a new environmental record for monitoring extremes」(気候ハザードの赤外線降水量の観測所データ - 極端な気象をモニタリングするための新しい環境記録)。Scientific Data 2, 150066. doi:10.1038/sdata.2015.66 2015 年。
Earth Engine で探索する
コードエディタ(JavaScript)
var dataset = ee.ImageCollection('UCSB-CHG/CHIRPS/DAILY')
                  .filter(ee.Filter.date('2018-05-01', '2018-05-03'));
var precipitation = dataset.select('precipitation');
var precipitationVis = {
  min: 1,
  max: 17,
  palette: ['001137', '0aab1e', 'e7eb05', 'ff4a2d', 'e90000'],
};
Map.setCenter(17.93, 7.71, 2);
Map.addLayer(precipitation, precipitationVis, 'Precipitation');
import ee
import geemap.core as geemap
Colab(Python)
dataset = ee.ImageCollection('UCSB-CHG/CHIRPS/DAILY').filter(
    ee.Filter.date('2018-05-01', '2018-05-03')
)
precipitation = dataset.select('precipitation')
precipitation_vis = {
    'min': 1,
    'max': 17,
    'palette': ['001137', '0aab1e', 'e7eb05', 'ff4a2d', 'e90000'],
}

m = geemap.Map()
m.set_center(17.93, 7.71, 2)
m.add_layer(precipitation, precipitation_vis, 'Precipitation')
m