
این صفحه ابزار نقشه حرارتی (heatmap) موجود در کتابخانه ابزار Maps SDK برای iOS را شرح میدهد. نقشههای حرارتی برای نمایش توزیع و تراکم نقاط داده روی نقشه مفید هستند.
این ویدیو در مورد استفاده از نقشههای حرارتی به عنوان جایگزینی برای نشانگرها، زمانی که دادههای شما به تعداد زیادی نقطه داده روی نقشه نیاز دارند، بحث میکند.
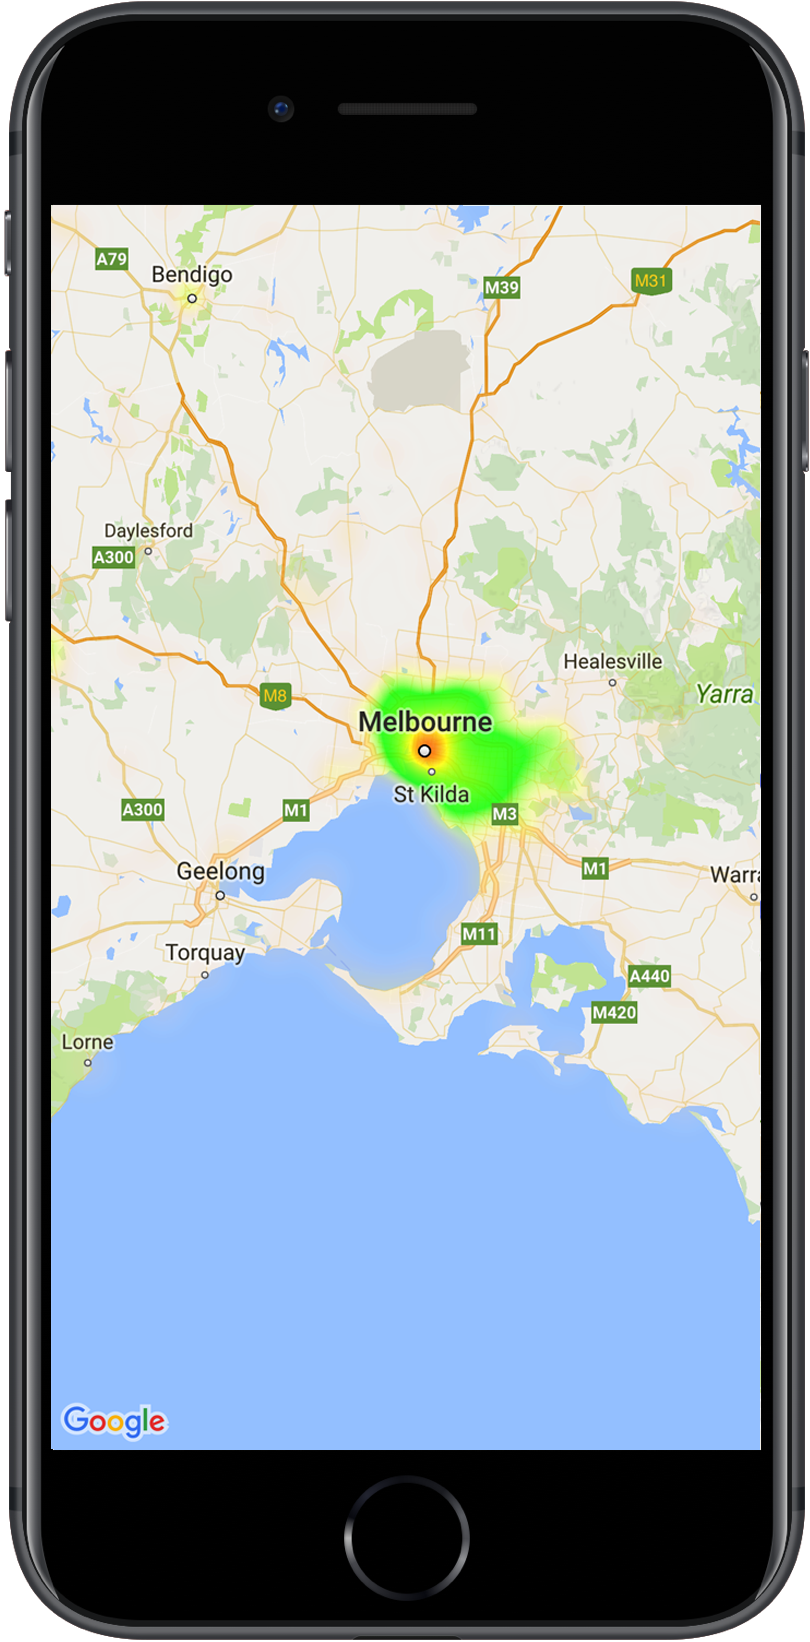
نقشههای حرارتی درک توزیع و شدت نسبی نقاط داده روی نقشه را برای بینندگان آسان میکنند. نقشههای حرارتی به جای قرار دادن یک نشانگر در هر مکان، از رنگ برای نمایش توزیع دادهها استفاده میکنند.
در مثال زیر، رنگ قرمز نشاندهنده مناطقی با تمرکز بالای ایستگاههای پلیس در ویکتوریا، استرالیا است.
اگر هنوز کتابخانه را راهاندازی نکردهاید، قبل از خواندن ادامهی این صفحه، راهنمای راهاندازی را دنبال کنید.
اضافه کردن یک نقشه حرارتی ساده
برای افزودن نقشه حرارتی به نقشه خود، به یک مجموعه داده متشکل از مختصات هر مکان مورد نظر نیاز دارید. ابتدا، یک نمونه GMUHeatmapTileLayer ایجاد کنید و ویژگی map را روی GMSMapView تنظیم کنید. این کار را در تابع viewDidLoad() برنامه خود انجام دهید تا مطمئن شوید که نقشه پایه قبل از کار با نقشه حرارتی بارگذاری شده است. سپس مجموعهای از اشیاء GMUWeightedLatLng را به نمونه GMUHeatmapTileLayer منتقل کنید.
این ابزار کلاس GMUHeatmapTileLayer را ارائه میدهد که مجموعهای از اشیاء GMUWeightedLatLng را میپذیرد. این کلاس تصاویر کاشی را برای سطوح مختلف بزرگنمایی، بر اساس گزینههای شعاع، گرادیان و شفافیت ارائه شده، ایجاد میکند.
مراحل را با جزئیات بیشتر بررسی کنید:
- یک نمونه
GMUHeatmapTileLayerایجاد کنید و ویژگیmapرا رویGMSMapViewتنظیم کنید (این کار را در تابعviewDidLoad()برنامه خود انجام دهید). - مجموعهای از اشیاء
GMUWeightedLatLngرا به نمونهGMUHeatmapTileLayerمنتقل کنید. - با ارسال نمای نقشه،
GMUHeatmapTileLayer.mapرا فراخوانی کنید.سویفت
class Heatmap: UIViewController {

  private var mapView: GMSMapView!
  private var heatmapLayer: GMUHeatmapTileLayer!

  override func viewDidLoad() {
    super.viewDidLoad()
    heatmapLayer = GMUHeatmapTileLayer()
    heatmapLayer.map = mapView
  }

  // ...

  func addHeatmap() {

    // Get the data: latitude/longitude positions of police stations.
    guard let path = Bundle.main.url(forResource: "police_stations", withExtension: "json") else {
      return
    }
    guard let data = try? Data(contentsOf: path) else {
      return
    }
    guard let json = try? JSONSerialization.jsonObject(with: data, options: []) else {
      return
    }
    guard let object = json as? [[String: Any]] else {
      print("Could not read the JSON.")
      return
    }

    var list = [GMUWeightedLatLng]()
    for item in object {
      let lat = item["lat"] as! CLLocationDegrees
      let lng = item["lng"] as! CLLocationDegrees
      let coords = GMUWeightedLatLng(
        coordinate: CLLocationCoordinate2DMake(lat, lng),
        intensity: 1.0
      )
      list.append(coords)
    }

    // Add the latlngs to the heatmap layer.
    heatmapLayer.weightedData = list
  }
}
هدف-سی
@implementation Heatmap {
  GMSMapView *_mapView;
  GMUHeatmapTileLayer *_heatmapLayer;
}

- (void)viewDidLoad {
  [super viewDidLoad];
  _heatmapLayer = [[GMUHeatmapTileLayer alloc] init];
  _heatmapLayer.map = _mapView;
}

// ...

- (void) addHeatmap {

  // Get the data: latitude/longitude positions of police stations.
  NSURL *path = [NSBundle.mainBundle URLForResource:@"police_stations" withExtension:@"json"];
  NSData *data = [NSData dataWithContentsOfURL:path];
  NSArray *json = [NSJSONSerialization JSONObjectWithData:data options:0 error:nil];

  NSMutableArray<GMUWeightedLatLng *> *list = [[NSMutableArray alloc] init];
  [json enumerateObjectsUsingBlock:^(id  _Nonnull obj, NSUInteger idx, BOOL * _Nonnull stop) {
    NSDictionary *item = (NSDictionary *)obj;
    CLLocationDegrees lat = [(NSNumber *) [item valueForKey:@"lat"] doubleValue];
    CLLocationDegrees lng = [(NSNumber *) [item valueForKey:@"lng"] doubleValue];
    GMUWeightedLatLng *coords = [[GMUWeightedLatLng alloc] initWithCoordinate:CLLocationCoordinate2DMake(lat, lng)
                                                                    intensity:1.0];
    [list addObject:coords];
  }];


  // Add the latlngs to the heatmap layer.
  _heatmapLayer.weightedData = list;
}
@end
برای این مثال، دادهها در یک فایل JSON به نام police_stations.json ذخیره میشوند. در اینجا گزیدهای از فایل آمده است:
[
{"lat" : -37.1886, "lng" : 145.708 } ,
{"lat" : -37.8361, "lng" : 144.845 } ,
{"lat" : -38.4034, "lng" : 144.192 } ,
{"lat" : -38.7597, "lng" : 143.67 } ,
{"lat" : -36.9672, "lng" : 141.083 }
]
سفارشیسازی نقشه حرارتی
نقشه حرارتی چندین ویژگی قابل تنظیم دارد. میتوانید گزینهها را هنگام ایجاد اولیه نمونه GMUHeatmapTileLayer یا در هر زمانی با تنظیم مقدار جدید برای این گزینه، تنظیم کنید.
گزینههای زیر موجود است:
شعاع: اندازهی محوشدگی گاوسی اعمالشده روی نقشهی حرارتی، که بر حسب پیکسل بیان میشود. مقدار پیشفرض ۲۰ است. باید بین ۱۰ تا ۵۰ باشد.
GMUHeatmapTileLayer.radiusبرای تنظیم شعاع استفاده کنید.گرادیان: طیفی از رنگها که نقشه حرارتی برای تولید نقشه رنگی خود استفاده میکند، از کمترین تا بیشترین شدت. یک
GMUGradientبا استفاده از یک آرایه عدد صحیح حاوی رنگها و یک آرایه اعشاری که نقطه شروع هر رنگ را نشان میدهد، ایجاد میشود که به صورت درصدی از حداکثر شدت داده میشود و به صورت کسری از 0 تا 1 بیان میشود. برای یک گرادیان تک رنگ، فقط باید یک رنگ یا برای یک گرادیان چند رنگ، حداقل دو رنگ را مشخص کنید. نقشه رنگی با استفاده از درونیابی بین این رنگها تولید میشود. گرادیان پیشفرض دارای دو رنگ است. پارامترcolorMapSizeتعداد مراحل در گرادیان را تعریف میکند. اعداد بزرگتر منجر به گرادیان نرمتر میشوند، در حالی که اعداد کوچکتر انتقالهای واضحتری شبیه به یک نمودار کانتور ایجاد میکنند. ازGMUHeatmapTileLayer.gradientبرای تنظیم گرادیان استفاده کنید.شفافیت (Opacity): این میزان شفافیت کل لایه نقشه حرارتی است و از ۰ تا ۱ متغیر است. مقدار پیشفرض ۰.۷ است. برای تنظیم مقدار شفافیت
GMUHeatmapTileLayer.opacityاستفاده کنید.
برای مثال، یک Gradient ایجاد کنید:
سویفت
let gradientColors: [UIColor] = [.green, .red]
let gradientStartPoints: [NSNumber] = [0.2, 1.0]
heatmapLayer.gradient = GMUGradient(
  colors: gradientColors,
  startPoints: gradientStartPoints,
  colorMapSize: 256
)
هدف-سی
NSArray<UIColor *> *gradientColors = @[UIColor.greenColor, UIColor.redColor];
NSArray<NSNumber *> *gradientStartPoints = @[@0.2, @1.0];
_heatmapLayer.gradient = [[GMUGradient alloc] initWithColors:gradientColors
                                                 startPoints:gradientStartPoints
                                                colorMapSize:256];
برای تغییر میزان شفافیت یک نقشه حرارتی موجود:
سویفت
heatmapLayer.opacity = 0.7
هدف-سی
_heatmapLayer.opacity = 0.7;
بهروزرسانی یک گزینه موجود
برای بهروزرسانی گزینهای که قبلاً تنظیم شده است، این مراحل را دنبال کنید:
- گزینه را به مقدار دلخواه بهروزرسانی کنید.
- تابع
GMUHeatmapTileLayer.clearTileCache()را فراخوانی کنید.
تغییر مجموعه دادهها
برای تغییر مجموعه دادهای که نقشه حرارتی بر اساس آن ساخته شده است:
- مجموعه دادههای خود را بهروزرسانی کنید. از
GMUHeatmapTileLayer.weightedDataاستفاده کنید و آرایهای ازGMUWeightedLatLngرا ارسال کنید. - تابع
GMUHeatmapTileLayer.clearTileCache()را فراخوانی کنید.
حذف نقشه حرارتی
برای حذف یک نقشه حرارتی، تابع GMUHeatmapTileLayer.map را فراخوانی کنید و nil را به آن ارسال کنید.
سویفت
heatmapLayer.map = nil
هدف-سی
_heatmapLayer.map = nil;
برنامه آزمایشی را ببینید
برای مثال دیگری از پیادهسازی نقشه حرارتی، به HeatmapViewController در برنامه آزمایشی که همراه با کتابخانه کاربردی ارائه میشود، نگاهی بیندازید. راهنمای راهاندازی به شما نشان میدهد که چگونه برنامه آزمایشی را اجرا کنید.