개요
컬렉션을 사용해 정리하기
내 환경설정을 기준으로 콘텐츠를 저장하고 분류하세요.
데이터 세트에 대한 데이터 기반 스타일 지정 기능을 사용하면 자체 지리 정보 데이터 세트를 업로드하고, 이 데이터 세트의 데이터 지형지물에 맞춤 스타일을 적용하고, 지도에 이러한 데이터 지형지물을 표시할 수 있습니다. 점, 다중선, 다각형 도형을 기반으로 데이터 시각화를 생성하고 데이터 지형지물이 클릭 이벤트에 반응하도록 설정할 수 있습니다. 데이터 세트에 대한 데이터 기반 스타일 지정은 벡터 지도에서만 지원됩니다(지도 ID 필요).
데이터 세트에 대한 데이터 기반 스타일 지정 시작하기
맞춤 지리 정보 데이터 세트 추가
Google Cloud 콘솔 또는 Google Cloud Shell을 사용하여 맞춤 데이터를 추가하세요. 각 데이터 세트에는 고유 ID가 있으며, 이 ID는 지도 스타일과 연결할 수 있습니다.
다음과 같은 데이터 형식이 지원됩니다.
- GeoJSON
- 쉼표로 구분된 데이터(CSV)
- KML
데이터 세트 요구사항 및 제한사항에 관한 자세한 내용은 데이터 세트 만들기 및 관리를 참고하세요.
데이터 지형지물 스타일 지정
맞춤 데이터가 업로드되어 지도 스타일 및 지도 ID에 연결되면 데이터 지형지물에 스타일을 지정해 시각적 효과를 높이고 지형지물이 클릭 이벤트에 반응하도록 설정할 수 있습니다.
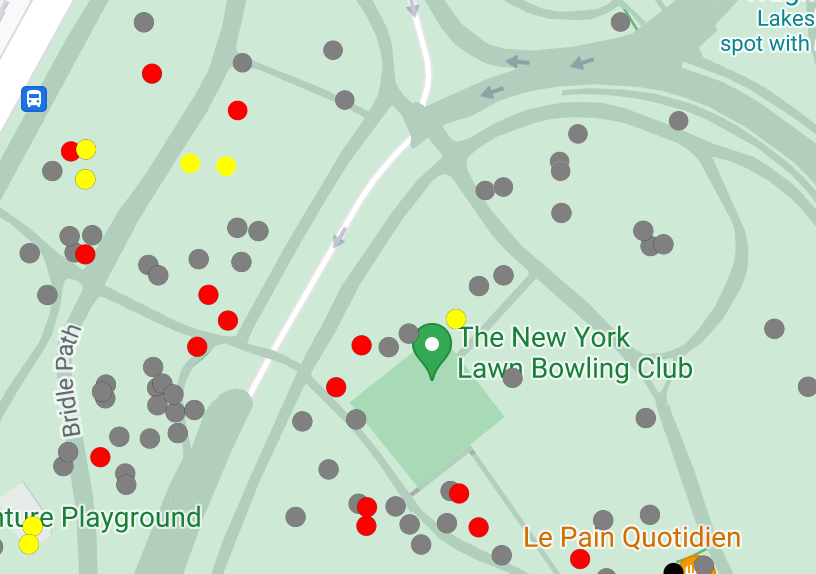
점 데이터의 스타일을 지정하여 지도에 특정 위치를 표시할 수 있습니다.
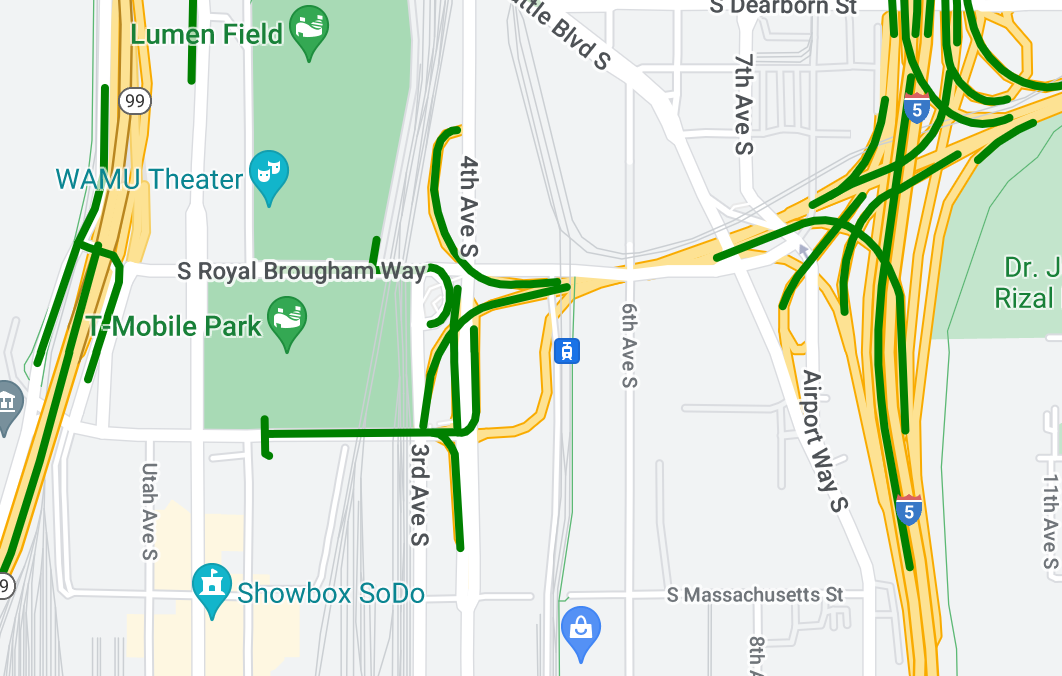
다중선 데이터의 스타일을 지정하여 지형지물을 강조 표시할 수 있습니다.
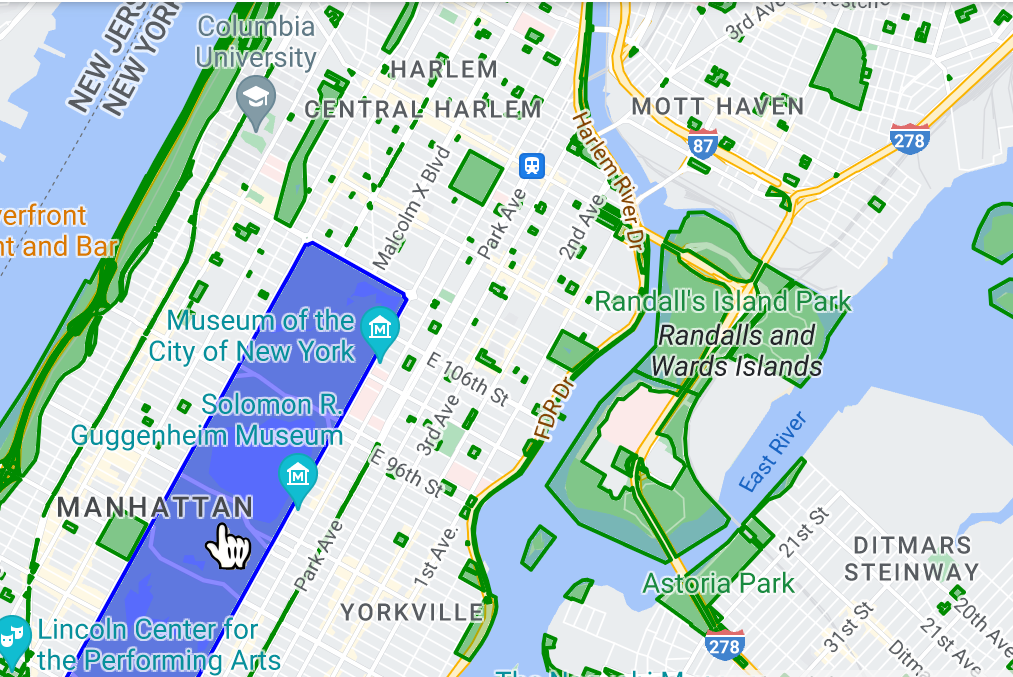
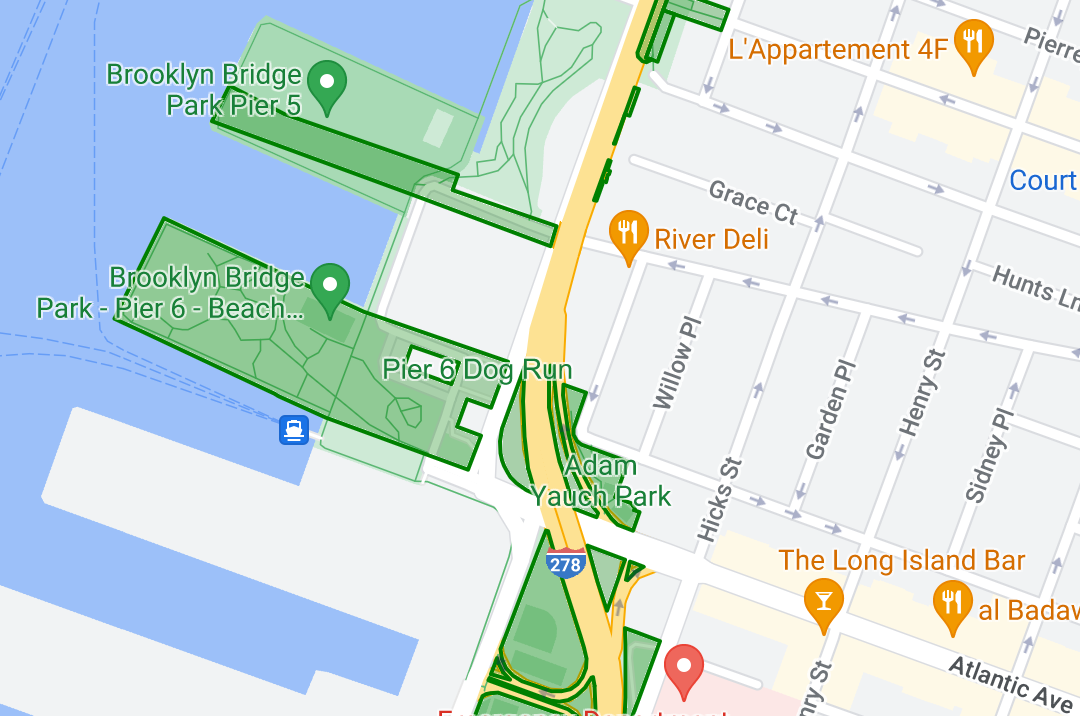
다각형 데이터의 스타일을 지정하여 지리적 영역을 강조 표시할 수 있습니다.
이벤트 리스너를 추가하여 데이터 지형지물이 클릭 이벤트에 반응하도록 설정할 수 있습니다.
달리 명시되지 않는 한 이 페이지의 콘텐츠에는 Creative Commons Attribution 4.0 라이선스에 따라 라이선스가 부여되며, 코드 샘플에는 Apache 2.0 라이선스에 따라 라이선스가 부여됩니다. 자세한 내용은 Google Developers 사이트 정책을 참조하세요. 자바는 Oracle 및/또는 Oracle 계열사의 등록 상표입니다.
최종 업데이트: 2025-08-31(UTC)
[null,null,["최종 업데이트: 2025-08-31(UTC)"],[[["\u003cp\u003eData-driven styling allows you to upload custom geospatial datasets (GeoJSON, CSV, KML) and visualize them on vector maps using points, polylines, and polygons.\u003c/p\u003e\n"],["\u003cp\u003eDatasets are managed through Google Cloud Console or Google Cloud Shell and are associated with map styles and IDs for display.\u003c/p\u003e\n"],["\u003cp\u003eYou can customize the visual appearance of data features based on their properties and enable click event interactions.\u003c/p\u003e\n"],["\u003cp\u003eData-driven styling enables the creation of dynamic and interactive data visualizations for highlighting locations, geographical features, and areas on maps.\u003c/p\u003e\n"]]],[],null,["Select platform: [Android](/maps/documentation/android-sdk/dds-datasets/overview \"View this page for the Android platform docs.\") [iOS](/maps/documentation/ios-sdk/dds-datasets/overview \"View this page for the iOS platform docs.\") [JavaScript](/maps/documentation/javascript/dds-datasets/overview \"View this page for the JavaScript platform docs.\")\n\n\u003cbr /\u003e\n\nData-driven styling for datasets lets you upload your own geospatial datasets,\napply custom styling to their data features, and display those data features on\nmaps. With data-driven styling for datasets, you can create data visualizations\nbased on point, polyline, and polygon geometries, and make data features respond\nto click events. Data-driven styling for datasets is supported on vector maps\nonly (a map ID is required).\n\n[Get started with data-driven styling for datasets](/maps/documentation/javascript/dds-datasets/start)\n\nAdd custom geospatial datasets\n\nAdd your custom data using Google Cloud Console or Google Cloud\nShell. Each dataset has a unique ID, which you can associate with a map style.\nThe following data formats are supported:\n\n- GeoJSON\n- Comma-separated (CSV)\n- KML\n\nFor details about dataset requirements and limitations, see\n[Create and manage a dataset](/maps/documentation/javascript/dds-datasets/create-dataset#dataset-prerequisites)\n\nStyle data features\n\nOnce your custom data has been uploaded and associated to a map\nstyle and map ID, you can style data features for visual impact, and make\nfeatures respond to click events.\n\nStyle point data to show specific locations on the map.\n\nStyle polyline data to highlight geographical features.\n\nStyle polygon data to highlight geographical areas.\n\nMake data features respond to click events by adding an event\nlistener."]]