监控
使用集合让一切井井有条
根据您的偏好保存内容并对其进行分类。
性能优化首先要确定关键指标,这些指标通常与延迟时间和吞吐量有关。添加监控功能以捕获和跟踪这些指标,可以发现应用中的薄弱环节。借助指标,您可以进行优化,以提升效果指标。
此外,许多监控工具还允许您为指标设置提醒,以便在达到特定阈值时收到通知。例如,您可以设置提醒,以便在失败请求的百分比比正常水平高出 x% 以上时收到通知。监控工具可帮助您了解正常性能是什么样的,并识别延迟时间、错误数量和其他关键指标的异常峰值。在业务关键时间段内或将新代码推送到生产环境后,监控这些指标的能力尤为重要。
确定延迟时间指标
确保界面尽可能保持响应性,同时注意用户对移动应用的期望更高。还应测量和跟踪后端服务的延迟时间,尤其是在延迟时间可能会导致吞吐量问题的情况下。
建议跟踪的指标包括:
- 请求时长
- 子系统粒度(例如 API 调用)的请求时长
- 作业时长
确定吞吐量指标
吞吐量是指在给定时间段内处理的请求总数。吞吐量可能会受到子系统延迟时间的影响,因此您可能需要优化延迟时间以提高吞吐量。
以下是一些建议跟踪的指标:
- 每秒查询次数
- 每秒传输的数据大小
- 每秒 I/O 操作数
- 资源利用率,例如 CPU 或内存用量
- 处理积压的大小,例如 Pub/Sub 或线程数
不仅仅是平均值
衡量性能时的一个常见错误是只关注平均情况。虽然这很有用,但无法深入了解延迟时间的分布情况。更好的跟踪指标是效果百分位数,例如某个指标的第 50/75/90/99 百分位数。
一般来说,优化可以分两步完成。首先,针对第 90 百分位延迟时间进行优化。然后,考虑第 99 百分位(也称为尾部延迟时间):完成时间远长于平均时间的少量请求。
服务器端监控,可提供详细结果
通常首选服务器端分析来跟踪指标。服务器端通常更容易检测,可以访问更精细的数据,并且不太容易受到连接问题的干扰。
浏览器监控,实现端到端可见性
浏览器分析可以提供有关最终用户体验的更多洞见。
它可以显示哪些网页的请求速度较慢,然后您可以将这些信息与服务器端监控数据相关联,以便进一步分析。
Google Analytics 可在网页加载时间报告中提供开箱即用的网页加载时间监控功能。这可提供多个实用视图,帮助您了解网站上的用户体验,尤其是:
Cloud 中的监控功能
您可以使用多种工具来捕获和监控应用的性能指标。例如,您可以使用 Google Cloud Logging 将性能指标记录到您的 Google Cloud 项目中,然后在 Google Cloud Monitoring 中设置信息中心,以监控和细分记录的指标。
如需查看如何从 Python 客户端库中的自定义拦截器向 Google Cloud Logging 记录日志的示例,请参阅日志记录指南。有了 Google Cloud 中的这些数据,您就可以基于日志数据构建指标,并通过 Google Cloud Monitoring 了解应用的情况。按照用户定义的基于日志的指标指南,使用发送到 Google Cloud Logging 的日志构建指标。
或者,您也可以使用 Monitoring 客户端库在代码中定义指标,并将其直接发送到 Monitoring,与日志分开。
基于日志的指标示例
假设您想监控 is_fault
值,以便更好地了解应用中的错误率。您可以从日志中提取 is_fault
值,并将其纳入新的计数器指标 ErrorCount
。


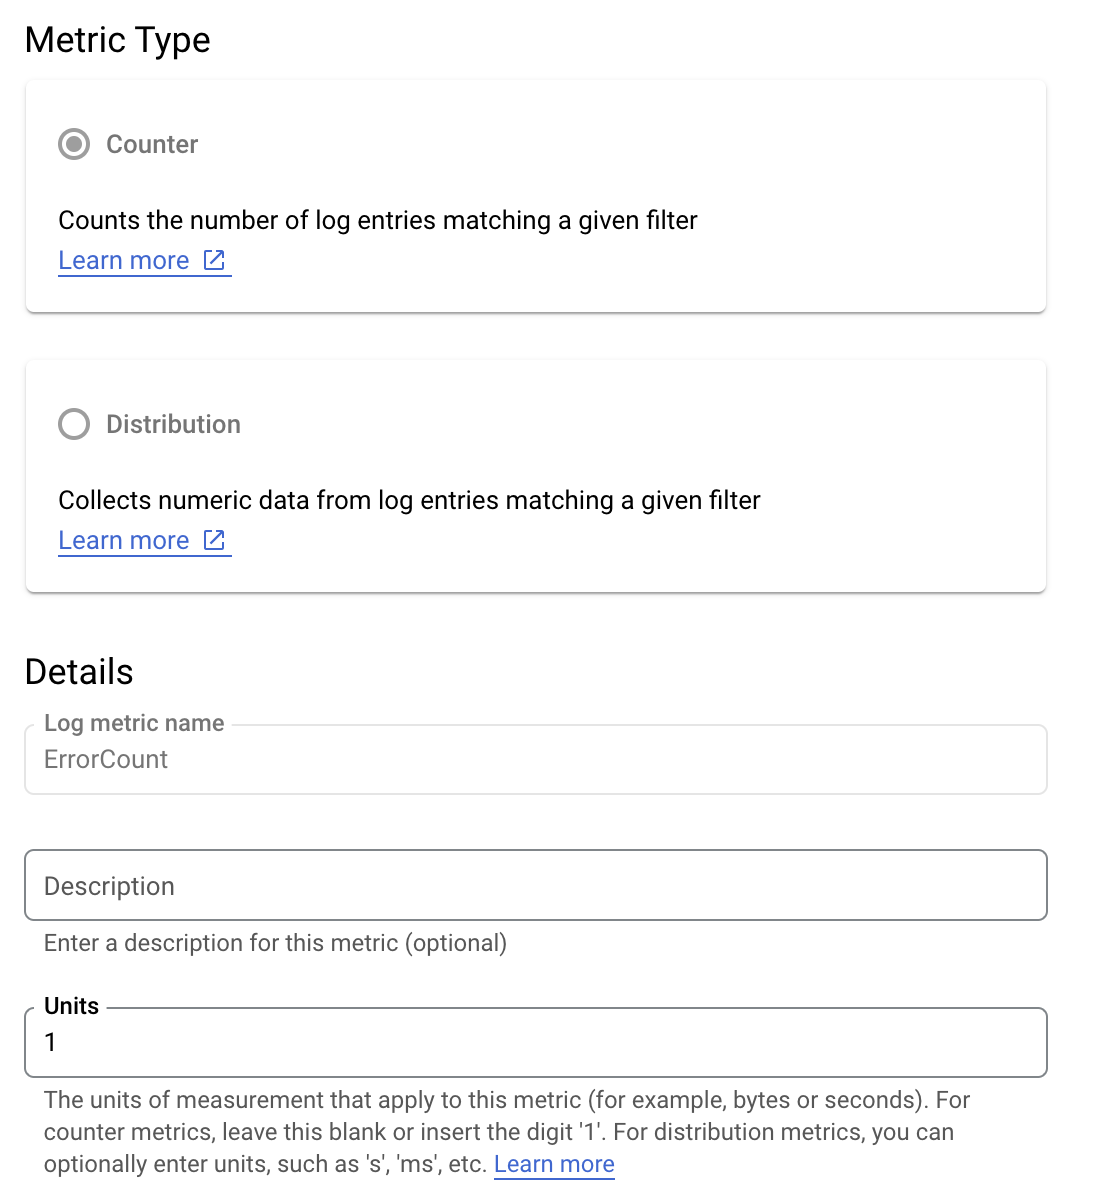
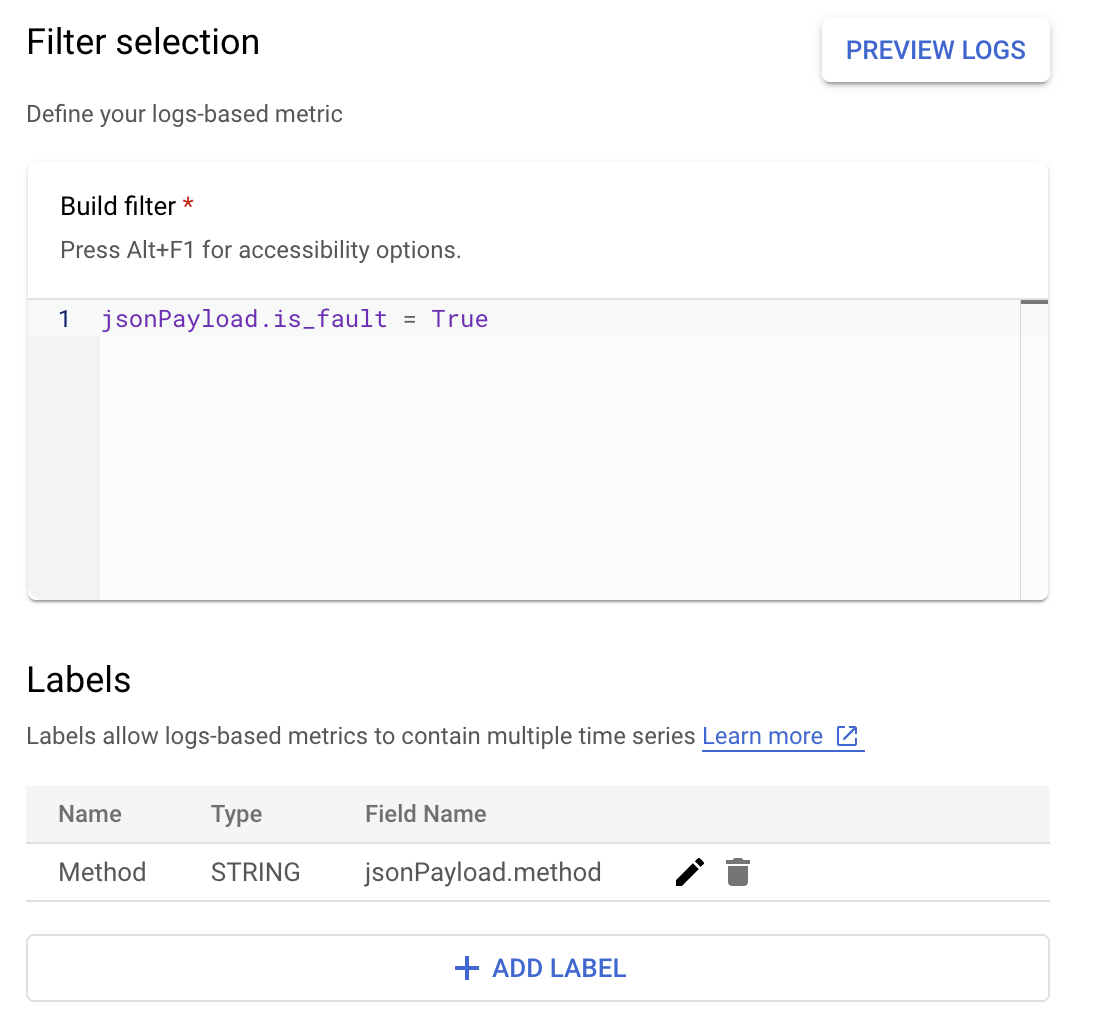
在 Cloud Logging 中,您可以利用标签根据日志中的其他数据将指标分组为不同的类别。您可以为发送到 Cloud Logging 的 method
字段配置标签,以便查看按 Google Ads API 方法细分的错误计数。
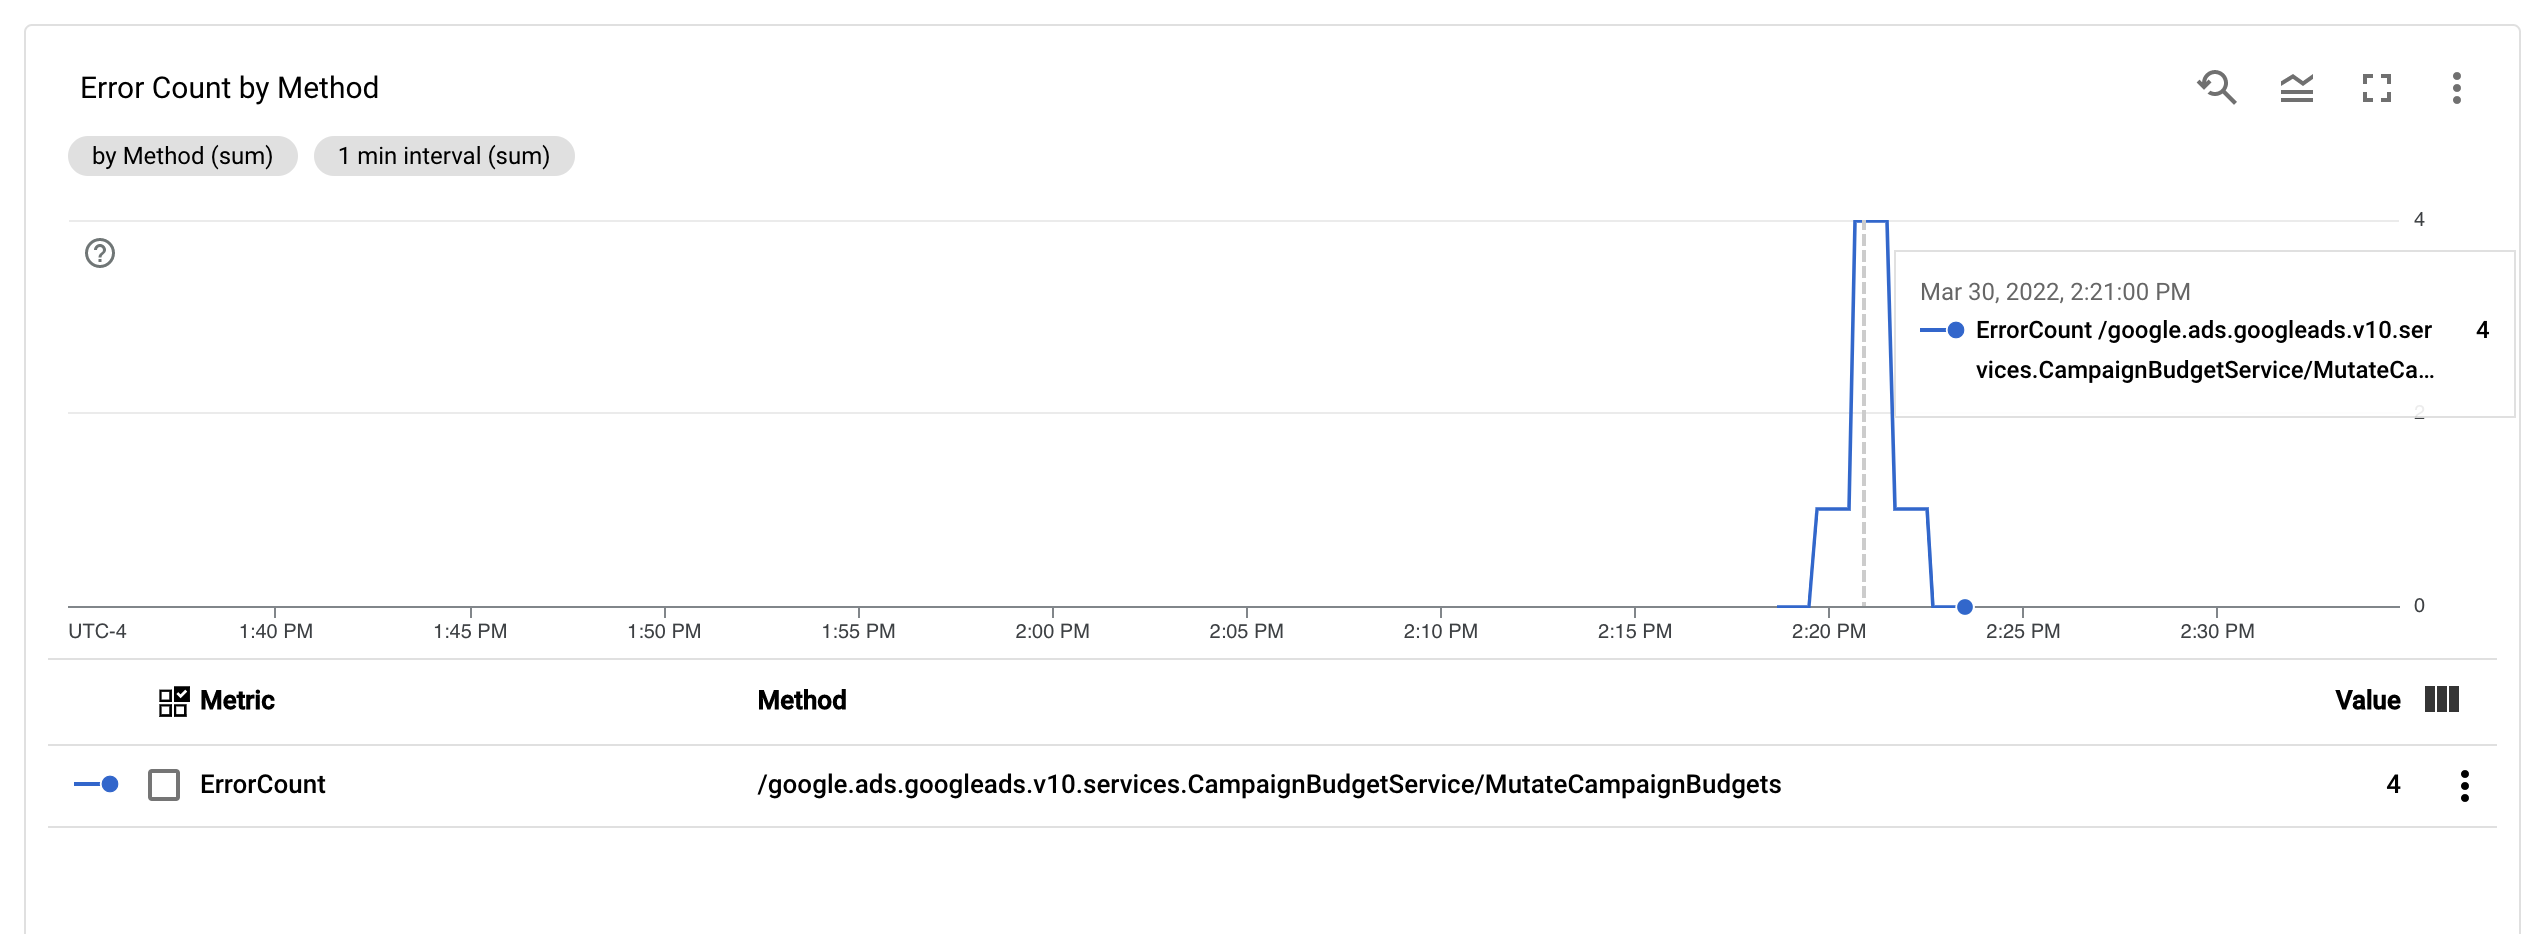
配置 ErrorCount
指标和 Method
标签后,您可以在 Monitoring 信息中心内创建新图表,以监控按 Method
分组的 ErrorCount
。

提醒
在 Cloud Monitoring 和其他工具中,您可以配置提醒政策,以指定指标应在何时以及如何触发提醒。如需有关设置 Cloud Monitoring 提醒的说明,请参阅提醒指南。
如未另行说明,那么本页面中的内容已根据知识共享署名 4.0 许可获得了许可,并且代码示例已根据 Apache 2.0 许可获得了许可。有关详情,请参阅 Google 开发者网站政策。Java 是 Oracle 和/或其关联公司的注册商标。
最后更新时间 (UTC):2025-08-27。
[null,null,["最后更新时间 (UTC):2025-08-27。"],[[["\u003cp\u003ePerformance optimization involves identifying key metrics like latency and throughput to pinpoint areas for improvement.\u003c/p\u003e\n"],["\u003cp\u003eMonitoring tools enable tracking of these metrics, setting up alerts for thresholds, and visualizing performance trends.\u003c/p\u003e\n"],["\u003cp\u003eOptimizing for latency percentiles, such as the 90th and 99th, offers a comprehensive approach to performance enhancement.\u003c/p\u003e\n"],["\u003cp\u003eServer-side and browser monitoring provide different perspectives, with server-side offering granular data and browser monitoring reflecting user experience.\u003c/p\u003e\n"],["\u003cp\u003eLeverage tools like Google Cloud Logging and Monitoring to capture, track, and analyze performance metrics, facilitating efficient optimization strategies.\u003c/p\u003e\n"]]],[],null,["# Monitoring\n\nPerformance optimization starts with identifying key metrics, usually related to\nlatency and throughput. The addition of monitoring to capture and track these\nmetrics exposes weak points in the application. With metrics, optimization can\nbe undertaken to improve performance metrics.\n\nAdditionally, many monitoring tools let you set up alerts for your metrics, so\nthat you are notified when a certain threshold is met. For example, you might\nset up an alert to notify you when the percentage of failed requests increases\nby more than *x*% of the normal levels. Monitoring tools can help you identify\nwhat normal performance looks like and identify unusual spikes in latency, error\nquantities, and other key metrics. The ability to monitor these metrics is\nespecially important during business critical timeframes, or after new code has\nbeen pushed to production.\n\nIdentify latency metrics\n------------------------\n\nEnsure that you keep your UI as responsive as you can, noting that users expect\neven higher standards from [mobile apps](/web/fundamentals/performance/why-performance-matters). Latency should also be measured\nand tracked for backend services, particularly since it can lead to throughput\nissues if left unchecked.\n\nSuggested metrics to track include the following:\n\n- Request duration\n- Request duration at subsystem granularity (such as API calls)\n- Job duration\n\nIdentify throughput metrics\n---------------------------\n\nThroughput is a measure of the total number of requests served over a given\nperiod of time. Throughput can be affected by latency of subsystems, so you\nmight need to optimize for latency to improve throughput.\n\nHere are some suggested metrics to track:\n\n- Queries per second\n- Size of data transferred per second\n- Number of I/O operations per second\n- Resource utilization, such as CPU or memory usage\n- Size of processing backlog, such as pub/sub or number of threads\n\nNot just the mean\n-----------------\n\nA common mistake in measuring performance is only looking at the mean (average)\ncase. While this is useful, it doesn't provide insight into the distribution of\nlatency. A better metric to track is the performance percentiles, for example\nthe 50th/75th/90th/99th percentile for a metric.\n\nGenerally, optimizing can be done in two steps. First, optimize for 90th\npercentile latency. Then, consider the 99th percentile---also known as tail\nlatency: the small portion of requests which take much longer to complete.\n\nServer-side monitoring for detailed results\n-------------------------------------------\n\nServer-side profiling is generally preferred for tracking metrics. The server\nside is usually much easier to instrument, allows access to more granular data,\nand is less subject to perturbation from connectivity issues.\n\nBrowser monitoring for end-to-end visibility\n--------------------------------------------\n\nBrowser profiling can provide additional insights into the end user experience.\nIt can show which pages have slow requests, which you can then correlate to\nserver-side monitoring for further analysis.\n\n[Google Analytics](/analytics) provides out-of-the-box monitoring for page load\ntimes in the [page timings report](//support.google.com/analytics/answer/1205784#PageTimings). This provides several useful views\nfor understanding the user experience on your site, in particular:\n\n- Page load times\n- Redirect load times\n- Server response times\n\nMonitoring in the cloud\n-----------------------\n\n\u003cbr /\u003e\n\n\u003cbr /\u003e\n\nThere are many tools you can use to capture and monitor performance metrics for\nyour application. For example, you can use [Google Cloud Logging](//cloud.google.com/logging) to log\nperformance metrics to your [Google Cloud Project](/google-ads/api/docs/oauth/cloud-project), then set up\ndashboards in [Google Cloud Monitoring](//cloud.google.com/monitoring) to monitor and segment the logged\nmetrics.\n\nCheck out the [Logging guide](/google-ads/api/docs/productionize/logging) for an [example](/google-ads/api/docs/productionize/logging#option_4_implement_a_custom_grpc_logging_interceptor) of logging to\nGoogle Cloud Logging from a custom interceptor in the Python client library.\nWith that data available in Google Cloud, you can build metrics on top of the\nlogged data to gain visibility into your application through Google Cloud\nMonitoring. Follow the [guide](//cloud.google.com/logging/docs/logs-based-metrics#user-defined_metrics) for user-defined log-based metrics to\nbuild metrics using the logs sent to Google Cloud Logging.\n\nAlternatively, you could use the Monitoring client [libraries](//cloud.google.com/monitoring/docs/reference/libraries) to define\nmetrics in your code and send them directly to Monitoring, separate from the\nlogs.\n\n### Log-based metrics example\n\nSuppose you want to monitor the `is_fault` value to better understand error\nrates in your application. You can extract the `is_fault` value from the logs\ninto a new [counter metric](//cloud.google.com/logging/docs/logs-based-metrics/counter-metrics), `ErrorCount`.\n\nIn Cloud Logging, [labels](//cloud.google.com/logging/docs/logs-based-metrics/labels) let you group your metrics into categories\nbased on other data in the logs. You can configure a label for the [`method`\nfield sent to Cloud Logging](/google-ads/api/docs/productionize/logging#option_4_implement_a_custom_grpc_logging_interceptor) in order to look at how the error count is\nbroken down by the Google Ads API method.\n\nWith the `ErrorCount` metric and the `Method` label configured, you can [create\na new\nchart](//cloud.google.com/logging/docs/logs-based-metrics/charts-and-alerts) in\na Monitoring dashboard to monitor `ErrorCount`, grouped by `Method`.\n\n### Alerts\n\nIt's possible in Cloud Monitoring and in other tools to configure alert policies\nthat specify when and how alerts should be triggered by your metrics. For\ninstructions on setting up Cloud Monitoring alerts, follow the\n[alerts guide](//cloud.google.com/logging/docs/logs-based-metrics/charts-and-alerts#alert-on-lbm)."]]