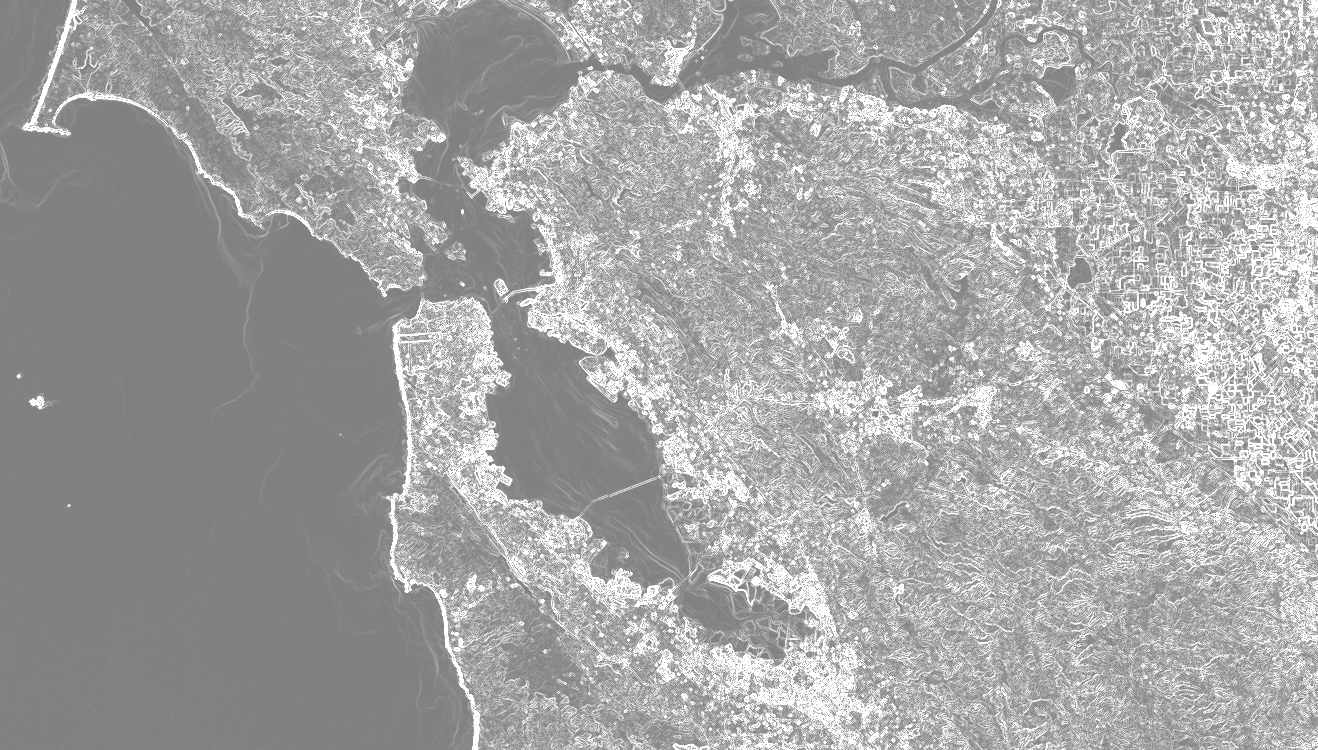
[null,null,["最后更新时间 (UTC):2025-07-25。"],[[["\u003cp\u003eThe \u003ccode\u003eimage.gradient()\u003c/code\u003e function in Google Earth Engine calculates the gradient of each band in an image, yielding X and Y direction components.\u003c/p\u003e\n"],["\u003cp\u003eBy combining the X and Y gradient components, you can derive both the gradient magnitude and direction.\u003c/p\u003e\n"],["\u003cp\u003eThe gradient magnitude represents the rate of change in pixel values, while the direction indicates the orientation of this change.\u003c/p\u003e\n"],["\u003cp\u003eVisualizing the gradient can highlight areas of rapid change in the image, such as edges and textures.\u003c/p\u003e\n"],["\u003cp\u003eThis functionality is demonstrated using Landsat 8 panchromatic data, showcasing the gradient over the San Francisco Bay area.\u003c/p\u003e\n"]]],["The `image.gradient()` function computes the gradient of each image band, outputting X and Y-direction gradients. The example loads a Landsat 8 panchromatic band image, calculates the X and Y gradients, then determines the gradient's magnitude by combining the squared X and Y values and the gradient's direction using `atan2` function. Finally, it displays the gradient and its direction, centered on San Francisco. The image gradient magnitude is then illustrated.\n"],null,["# Gradients\n\nYou can compute the gradient of each band of an image with `image.gradient()`.\nFor example, the following code computes the gradient magnitude and direction of the\nLandsat 8 panchromatic band:\n\n### Code Editor (JavaScript)\n\n```javascript\n// Load a Landsat 8 image and select the panchromatic band.\nvar image = ee.Image('LANDSAT/LC08/C02/T1/LC08_044034_20140318').select('B8');\n\n// Compute the image gradient in the X and Y directions.\nvar xyGrad = image.gradient();\n\n// Compute the magnitude of the gradient.\nvar gradient = xyGrad.select('x').pow(2)\n .add(xyGrad.select('y').pow(2)).sqrt();\n\n// Compute the direction of the gradient.\nvar direction = xyGrad.select('y').atan2(xyGrad.select('x'));\n\n// Display the results.\nMap.setCenter(-122.054, 37.7295, 10);\nMap.addLayer(direction, {min: -2, max: 2, format: 'png'}, 'direction');\nMap.addLayer(gradient, {min: -7, max: 7, format: 'png'}, 'gradient');\n```\n\nNote that `gradient()` outputs two bands: the gradient in the X-direction and the\ngradient in the Y-direction. As shown in the example, the two directions can be combined to\nget gradient magnitude and direction. The magnitude should look something like Figure 1.\nFigure 1. Panchromatic gradient magnitude for the Landsat 8 imagery over the San Francisco Bay area, California, USA."]]