GSW 数据集包含许多以不同方式呈现地表水数据的数据层。我们将首先直观呈现水体出现图层,该图层汇总了 1984 年 3 月至 2015 年 10 月整个时间段内地表水体出现的位置和频率。
本教程的这一部分将:
- 添加用于直观呈现地表水出现情况的地图图层,
- 展示如何查询地图图层的值,
- 添加自定义样式以改进可视化图表,
- 使用阈值创建二元水掩膜层,
- 将地图中心设为世界上的有趣地点,以及
- 展示如何重构脚本,使其更易于阅读和维护。
创建基本可视化图表
首先,将以下语句复制到代码编辑器中:
代码编辑器 (JavaScript)
var gsw = ee.Image('JRC/GSW1_0/GlobalSurfaceWater');
var occurrence = gsw.select('occurrence');
Map.addLayer(occurrence);
第一条语句引用 GSW 数据集的 Earth Engine Image 对象,并将其存储在名为 gsw 的变量中。
第二条语句选择 GSW 数据集中的单个层,并将其存储在名为 occurrence 的变量中。
第三条语句将出现次数图片添加到代码编辑器的互动式地图中。
点击代码编辑器的“运行”按钮,几秒钟后,您应该会看到一张地图,其中沿海地区以灰色着色,如图 1 所示。
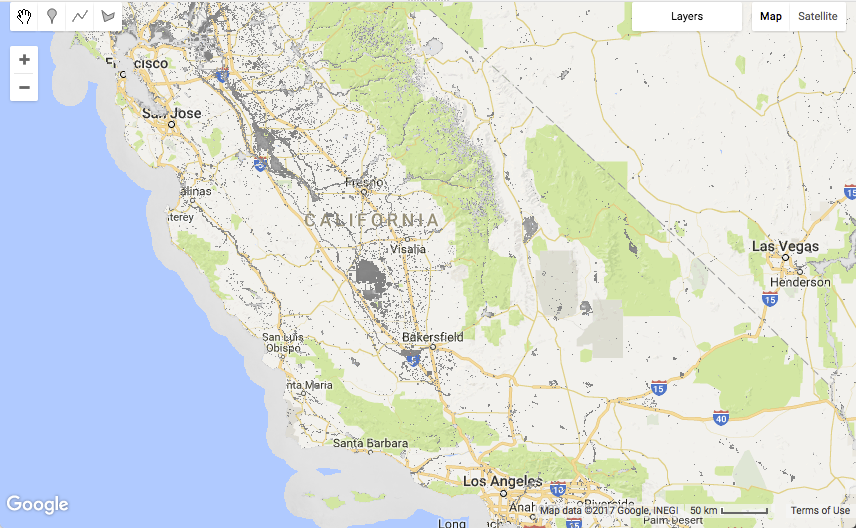
在大多数区域,GSW 数据集显示为透明,因为未收集 Landsat 图像的区域(即海洋区域)或 32 年内任何观测结果都未检测到水的区域都 被遮盖了。
检查值
如需探索水体出现频率层的值,我们将使用代码编辑器的检查器标签页。 首先点击检查器标签页,然后点击地图以选择位置。检查器标签页将显示您点击的位置处存在的每个图层的信息。
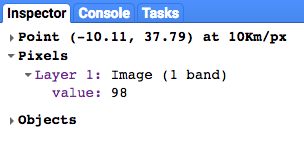
在上面的示例中,名为 value 的层的值为 98。单位为百分点,因此大约 98% 的时间,相应位置被归类为水覆盖区域。该值是每个月地表水出现次数值的平均值,可根据季节性变化进行归一化,如
《数据用户指南》(v2)
中所述。
重构以改进代码
我们的脚本只包含两个语句,但我们已经有机会重构代码,以便最终的脚本在日后更易于阅读和维护。
目前,Map.addLayer() 语句传递单个实参 occurrence,即我们要在地图上显示的 Earth Engine 影像对象。不过,Map.addLayer() 方法还允许向其传递其他实参。如需快速查看可用的实参,请将光标放在左括号后面,然后按“显示代码建议”的键盘快捷键,以调出 addLayer 方法的帮助文档。(如需查看键盘快捷键,请依次选择菜单“帮助”->“快捷键”。)
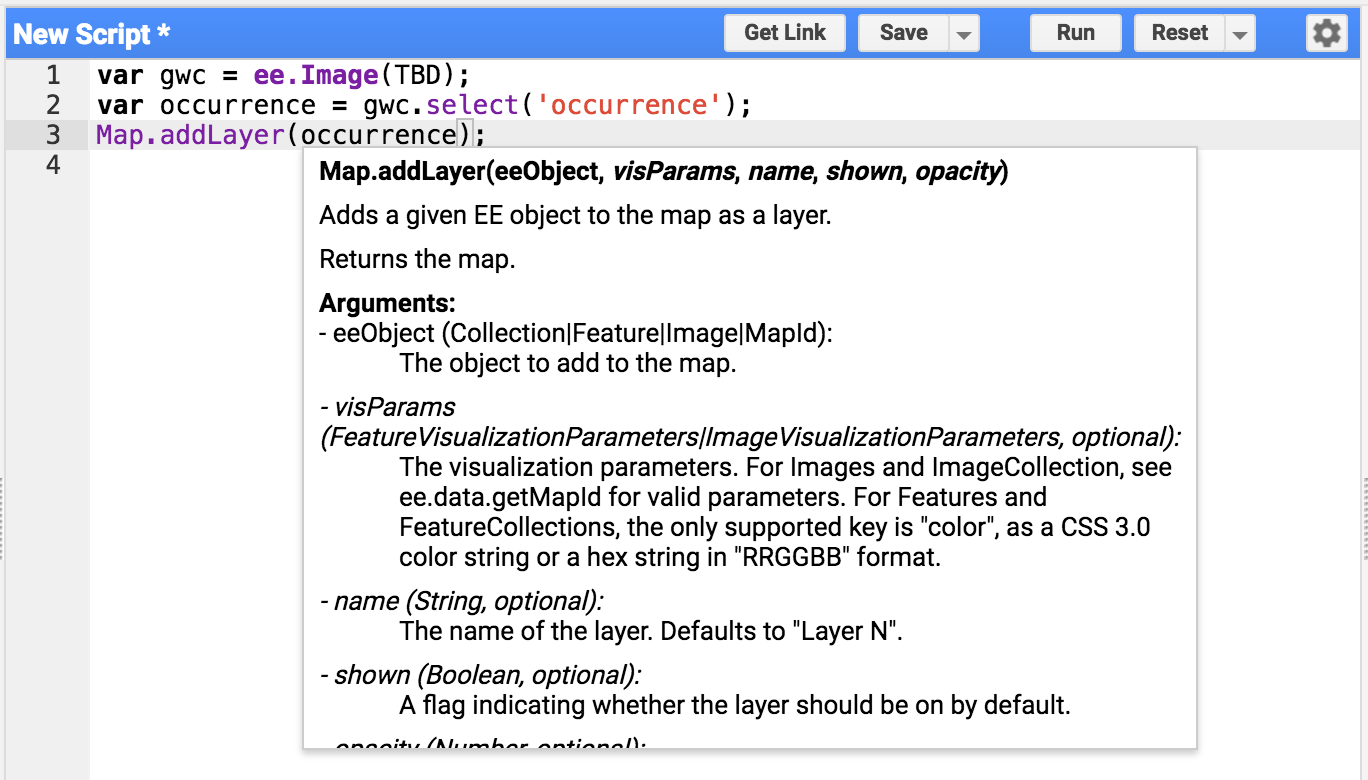
键盘快捷键显示,有五个实参可以传递给 Map.addLayer:eeObject、visParams、name、shown 和 opacity。
在当前脚本中,我们传递了一个变量 occurrence,该变量被解读为第一个实参 eeObject。
为了同时传递变量对象和用于命名层的其他实参,我们可以重构代码以使用“命名实参”(eeObject 和 name),这些实参会从
JSON 数据结构
中传递到方法中,如下所示:
代码编辑器 (JavaScript)
Map.addLayer({eeObject: occurrence, name: 'Water Occurrence (1984-2015)'});
再次运行代码,确保在重构更改后代码仍能正常运行。 生成的地图应保持不变。
添加可视化参数
接下来,我们将着手改进默认的可视化参数,这些参数会导致水呈现灰色。添加一条新语句,用于创建变量 VIS_OCCURRENCE 并将其作为额外的实参传递给 addLayer 方法。
代码编辑器 (JavaScript)
var VIS_OCCURRENCE = {
  min: 0,
  max: 100,
  palette: ['red', 'blue']
};
代码编辑器 (JavaScript)
Map.addLayer({
  eeObject: occurrence.updateMask(occurrence.divide(100)),
  name: 'Water Occurrence (1984-2015)',
  visParams: VIS_OCCURRENCE
});
存储在 JSON 结构 VIS_OCCURRENCE 中的可视化图表参数表示,最小值 0% 应使用红色,最大值 100% 应使用蓝色。添加 .updateMask(occurrence.divide(100)) 后,系统会根据出现次数值设置像素的不透明度/透明度。
再次运行脚本,查看样式更改后的修订结果。
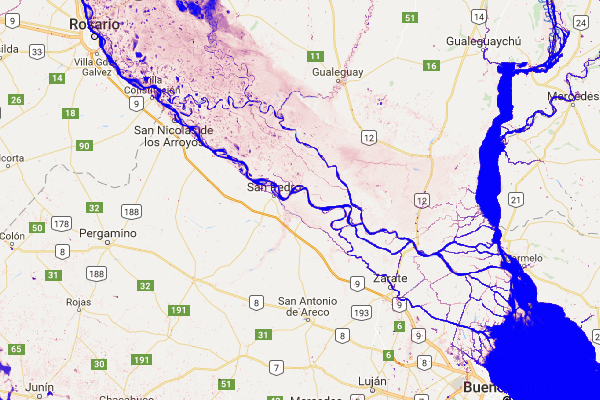
水域现在是蓝色的!进展不错!
创建阈值层
水体出现频率图片包含有关水体出现频率的信息,使用 0 到 100% 的值范围表示。不过,根据出现频率(即阈值),定义一个二元水层(即“水”与“非水”)通常很有用。我们将使用以下简单的二元层作为干净的背景层,其他 GSW 层可以放置在该层之上。 您可以使用以下语句创建此阈值层,该语句使用 90% 的阈值来区分水和非水。
首先,我们定义一个新的可视化变量 VIS_WATER_MASK,用于保存水掩膜的样式信息:
代码编辑器 (JavaScript)
var VIS_WATER_MASK = {
  palette: ['white', 'black']
};
然后,我们使用大于比较运算符 .gt(90) 计算水体掩码层,再使用 .unmask() 方法将之前掩盖的区域设置为零:
代码编辑器 (JavaScript)
// Create a water mask layer, and set the image mask so that non-water areas
// are opaque.
var water_mask = occurrence.gt(90).unmask(0);
最后,将图层添加到地图中。如需使此图层显示在所有其他图层下方,请将以下语句放在任何其他 Map.addLayer 语句之前。
代码编辑器 (JavaScript)
Map.addLayer({
  eeObject: water_mask,
  visParams: VIS_WATER_MASK,
  name: '90% occurrence water mask'
});
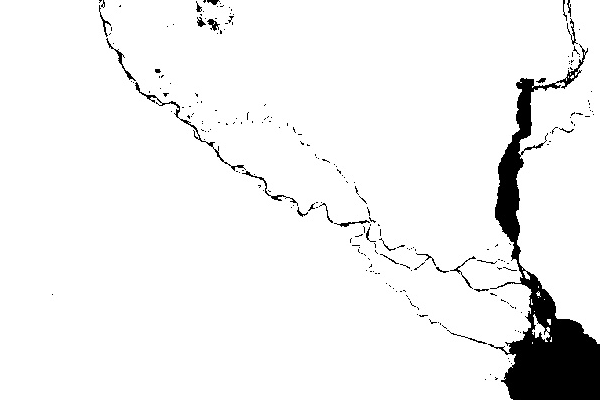
前往世界各地有趣的地方
平移和缩放地图来探索世界很有趣,但世界很大,有时直接跳转到特定位置会很有帮助。 以下是一系列陈述,其中提供了一些在地面水方面很有趣的位置的小样本。 只需一次取消注释一个语句,脚本在运行时就会前往相应位置。
代码编辑器 (JavaScript)
// Uncomment one of the following statements to center the map.
// Map.setCenter(-90.162, 29.8597, 10);   // New Orleans, USA
// Map.setCenter(-114.9774, 31.9254, 10); // Mouth of the Colorado River, Mexico
// Map.setCenter(-111.1871, 37.0963, 11); // Lake Powell, USA
// Map.setCenter(149.412, -35.0789, 11);  // Lake George, Australia
// Map.setCenter(105.26, 11.2134, 9);     // Mekong River Basin, SouthEast Asia
// Map.setCenter(90.6743, 22.7382, 10);   // Meghna River, Bangladesh
// Map.setCenter(81.2714, 16.5079, 11);   // Godavari River Basin Irrigation Project, India
// Map.setCenter(14.7035, 52.0985, 12);   // River Oder, Germany & Poland
// Map.setCenter(-59.1696, -33.8111, 9);  // Buenos Aires, Argentina
Map.setCenter(-74.4557, -8.4289, 11);  // Ucayali River, Peru
这只是部分有趣地点的示例。欢迎自行添加!
再次重构…
在继续处理 GSW 数据集的下一层之前,我们将进行一些代码重构。具体来说,我们将把类似的语句归为一组,并添加一些注释,将代码分成几个部分,分别用于资源、常量、计算、地图居中和添加地图图层。
以下是最终重构的脚本:
代码编辑器 (JavaScript)
//////////////////////////////////////////////////////////////
// Asset List
//////////////////////////////////////////////////////////////

var gsw = ee.Image('JRC/GSW1_0/GlobalSurfaceWater');
var occurrence = gsw.select('occurrence');

//////////////////////////////////////////////////////////////
// Constants
//////////////////////////////////////////////////////////////

var VIS_OCCURRENCE = {
  min: 0,
  max: 100,
  palette: ['red', 'blue']
};
var VIS_WATER_MASK = {
  palette: ['white', 'black']
};

//////////////////////////////////////////////////////////////
// Calculations
//////////////////////////////////////////////////////////////

// Create a water mask layer, and set the image mask so that non-water areas
// are opaque.
var water_mask = occurrence.gt(90).unmask(0);

//////////////////////////////////////////////////////////////
// Initialize Map Location
//////////////////////////////////////////////////////////////

// Uncomment one of the following statements to center the map.
// Map.setCenter(-90.162, 29.8597, 10);   // New Orleans, USA
// Map.setCenter(-114.9774, 31.9254, 10); // Mouth of the Colorado River, Mexico
// Map.setCenter(-111.1871, 37.0963, 11); // Lake Powell, USA
// Map.setCenter(149.412, -35.0789, 11);  // Lake George, Australia
// Map.setCenter(105.26, 11.2134, 9);     // Mekong River Basin, SouthEast Asia
// Map.setCenter(90.6743, 22.7382, 10);   // Meghna River, Bangladesh
// Map.setCenter(81.2714, 16.5079, 11);   // Godavari River Basin Irrigation Project, India
// Map.setCenter(14.7035, 52.0985, 12);   // River Oder, Germany & Poland
// Map.setCenter(-59.1696, -33.8111, 9);  // Buenos Aires, Argentina
Map.setCenter(-74.4557, -8.4289, 11);  // Ucayali River, Peru

//////////////////////////////////////////////////////////////
// Map Layers
//////////////////////////////////////////////////////////////

Map.addLayer({
  eeObject: water_mask,
  visParams: VIS_WATER_MASK,
  name: '90% occurrence water mask',
  shown: false
});
Map.addLayer({
  eeObject: occurrence.updateMask(occurrence.divide(100)),
  name: 'Water Occurrence (1984-2015)',
  visParams: VIS_OCCURRENCE
});
在下一部分中,您将探索水体出现情况随时间的变化。
