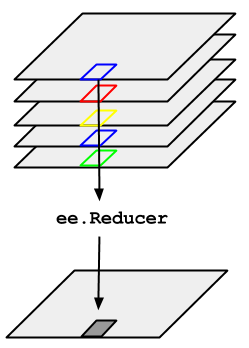
假设您需要对由 ImageCollection 表示的一组时间序列图像求中位数。如需缩减 ImageCollection,请使用 imageCollection.reduce()。这会将图片集合缩减为单个图片,如图 1 所示。具体而言,输出是按像素计算的,因此输出中的每个像素都由该位置上收集的所有图片的中位数值组成。如需获取其他统计信息(例如均值、总和、方差、任意百分位数等),应选择并应用适当的缩减器。(如需查看当前可用的所有 reducer 的列表,请参阅 Code Editor 中的 Docs 标签页)。对于最小值、最大值、平均值等基本统计信息,
ImageCollection 具有 min()、max()、mean() 等快捷方法。它们的运作方式与调用 reduce() 完全相同,但生成的频段名称不会附加缩减器的名称。

如需查看减少 ImageCollection 的示例,请考虑一个按路径和行过滤的 Landsat 5 图像集。以下代码使用 reduce() 将集合缩减为一个 Image(此处仅出于说明目的使用了中位数缩减器):
Code Editor (JavaScript)
// Load an image collection, filtered so it's not too much data.
var collection = ee.ImageCollection('LANDSAT/LT05/C02/T1')
  .filterDate('2008-01-01', '2008-12-31')
  .filter(ee.Filter.eq('WRS_PATH', 44))
  .filter(ee.Filter.eq('WRS_ROW', 34));

// Compute the median in each band, each pixel.
// Band names are B1_median, B2_median, etc.
var median = collection.reduce(ee.Reducer.median());

// The output is an Image.  Add it to the map.
var vis_param = {bands: ['B4_median', 'B3_median', 'B2_median'], gamma: 1.6};
Map.setCenter(-122.3355, 37.7924, 9);
Map.addLayer(median, vis_param);
import ee
import geemap.core as geemap
Colab (Python)
# Load an image collection, filtered so it's not too much data.
collection = (
    ee.ImageCollection('LANDSAT/LT05/C02/T1')
    .filterDate('2008-01-01', '2008-12-31')
    .filter(ee.Filter.eq('WRS_PATH', 44))
    .filter(ee.Filter.eq('WRS_ROW', 34))
)

# Compute the median in each band, each pixel.
# Band names are B1_median, B2_median, etc.
median = collection.reduce(ee.Reducer.median())

# The output is an Image.  Add it to the map.
vis_param = {'bands': ['B4_median', 'B3_median', 'B2_median'], 'gamma': 1.6}
m = geemap.Map()
m.set_center(-122.3355, 37.7924, 9)
m.add_layer(median, vis_param)
m
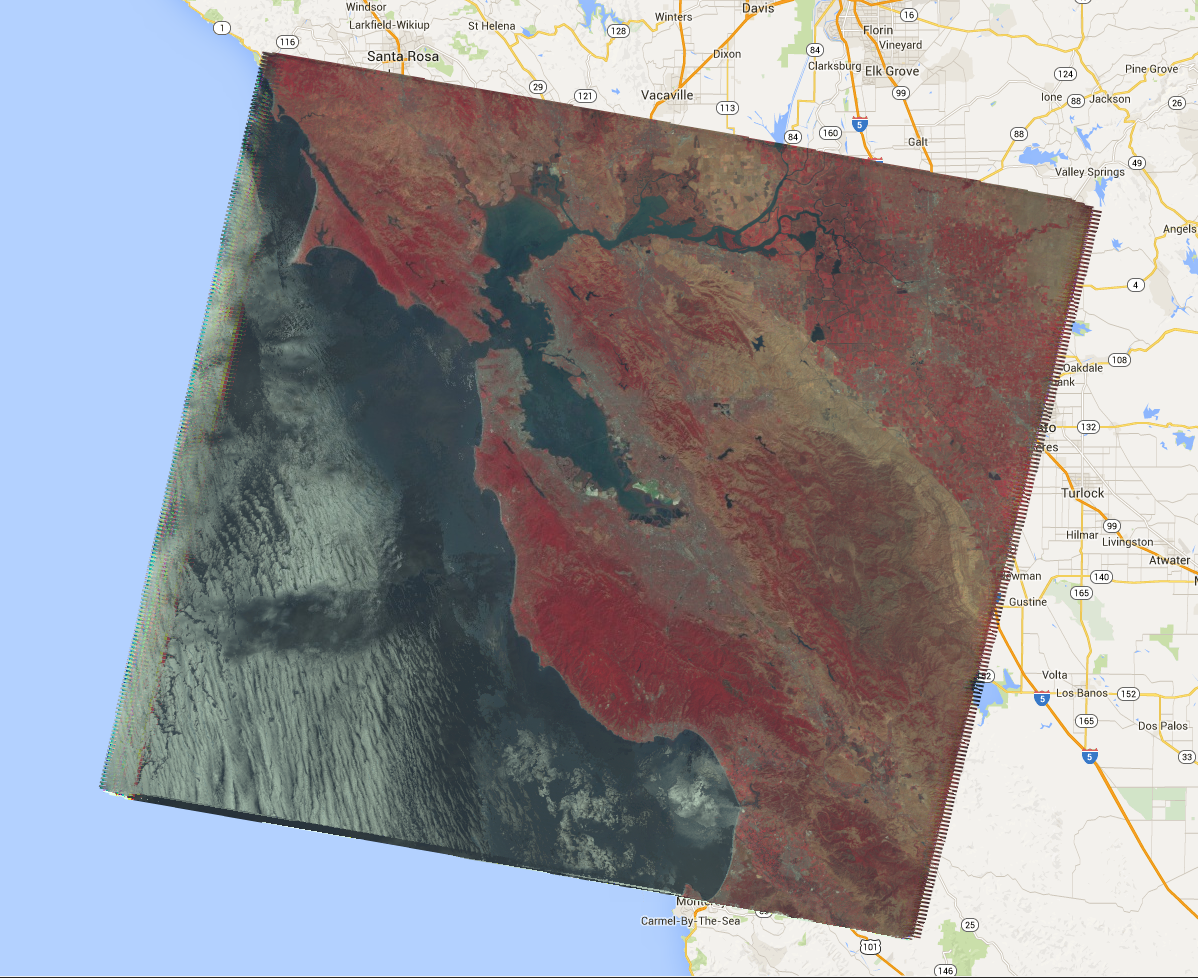
这会返回一个多波段 Image,其中每个像素都是 ImageCollection 中相应像素位置处所有未经掩码的像素的中位数。具体而言,系统会对输入图像的每个波段重复使用 reducer,这意味着系统会在每个波段中独立计算中位数。请注意,频段名称会附加还原程序的名称:'B1_median'、'B2_median' 等。输出应如下图 2 所示。
如需详细了解如何缩减图片合集,请参阅 ImageCollection 文档中的“缩减”部分。特别要注意的是,通过缩减 ImageCollection 生成的图片没有投影。这意味着,对于涉及通过 ImageCollection 缩减输出的计算图像的任何计算,您都应明确设置缩放比例。

