您还可以指定要应用 reducer 的邻域,而不是指定要执行求和的区域。如需减少图片邻域,请使用 image.reduceNeighborhood()。在这种情况下,缩减将在输入图片上的滑动窗口中进行,窗口大小和形状由 ee.Kernel 指定。reduceNeighborhood() 的输出将是另一张图片,其中每个像素值代表输入图片中相应像素周围邻域的求和输出。图 1 展示了此类缩减。
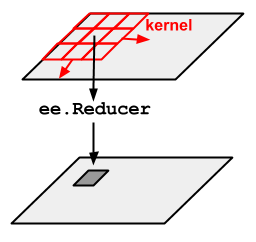
reduceNeighborhood() 示意图,其中 reducer 应用于内核。例如,考虑使用美国国家农业影像计划 (NAIP) 影像来量化加利福尼亚红杉森林遭到砍伐所造成的景观差异。
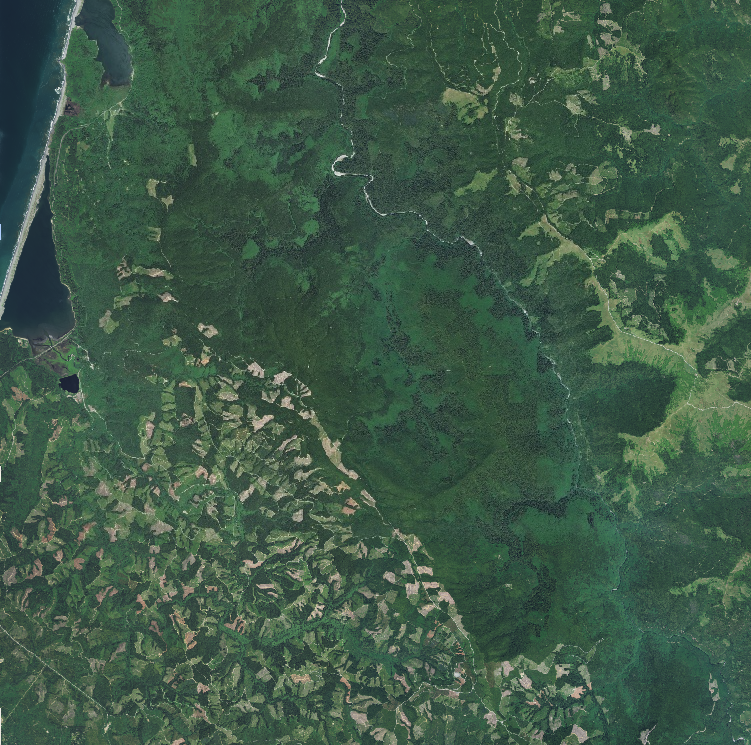
具体而言,使用邻域中的标准差 (SD) 来表示已记录区域(图 2 中图片的西南角)与受保护区域(图 2 中图片的东北角)之间的纹理差异。例如,如需获取 NAIP 常态化差值植生指数 (NDVI) 图像的纹理,请使用 reduceNeighborhood() 计算由核定义的邻域中的标准差:
Code Editor (JavaScript)
// Define a region in the redwood forest.
var redwoods = ee.Geometry.Rectangle(-124.0665, 41.0739, -123.934, 41.2029);

// Load input NAIP imagery and build a mosaic.
var naipCollection = ee.ImageCollection('USDA/NAIP/DOQQ')
  .filterBounds(redwoods)
  .filterDate('2012-01-01', '2012-12-31');
var naip = naipCollection.mosaic();

// Compute NDVI from the NAIP imagery.
var naipNDVI = naip.normalizedDifference(['N', 'R']);

// Compute standard deviation (SD) as texture of the NDVI.
var texture = naipNDVI.reduceNeighborhood({
  reducer: ee.Reducer.stdDev(),
  kernel: ee.Kernel.circle(7),
});

// Display the results.
Map.centerObject(redwoods, 12);
Map.addLayer(naip, {}, 'NAIP input imagery');
Map.addLayer(naipNDVI, {min: -1, max: 1, palette: ['FF0000', '00FF00']}, 'NDVI');
Map.addLayer(texture, {min: 0, max: 0.3}, 'SD of NDVI');
import ee
import geemap.core as geemap
Colab (Python)
# Define a region in the redwood forest.
redwoods = ee.Geometry.Rectangle(-124.0665, 41.0739, -123.934, 41.2029)

# Load input NAIP imagery and build a mosaic.
naip_collection = (
    ee.ImageCollection('USDA/NAIP/DOQQ')
    .filterBounds(redwoods)
    .filterDate('2012-01-01', '2012-12-31')
)
naip = naip_collection.mosaic()

# Compute NDVI from the NAIP imagery.
naip_ndvi = naip.normalizedDifference(['N', 'R'])

# Compute standard deviation (SD) as texture of the NDVI.
texture = naip_ndvi.reduceNeighborhood(
    reducer=ee.Reducer.stdDev(), kernel=ee.Kernel.circle(7)
)

# Display the results.
m = geemap.Map()
m.center_object(redwoods, 12)
m.add_layer(naip, {}, 'NAIP input imagery')
m.add_layer(
    naip_ndvi, {'min': -1, 'max': 1, 'palette': ['FF0000', '00FF00']}, 'NDVI'
)
m.add_layer(texture, {'min': 0, 'max': 0.3}, 'SD of NDVI')
m
计算中会包含核值不为零的任何像素。默认情况下,系统会使用核权重,但您可以使用 inputWeight 参数更改此行为。图 2 比较了输入图片和 reduceNeighborhood() 输出。
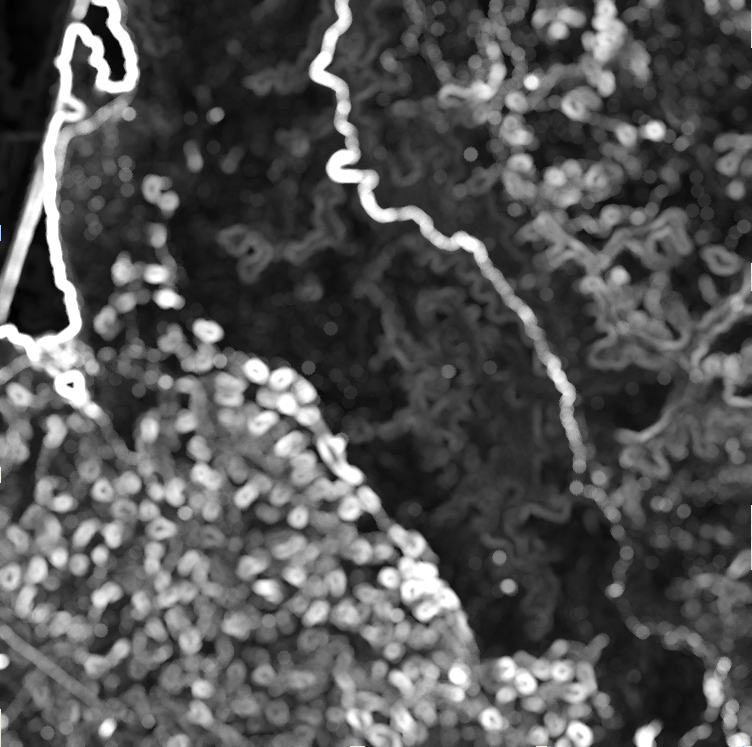
reduceNeighborhood() 输出。