水过渡层可捕获三种水出现类别(无水、季节性水和永久性水)之间的变化,以及两种额外的短暂性水类别(短暂性永久水和短暂性季节性水)。
本教程的这一部分将:
- 添加用于直观呈现水转变的地图图层,
- 创建一个分组的 reducer,用于计算指定感兴趣区域内每个过渡类别的面积,并
- 创建一个按过渡类汇总面积的图表。
基本可视化图表
在脚本的“资产列表”部分中,添加以下语句,以创建一个名为 transition 的单波段影像对象:
代码编辑器 (JavaScript)
var transition = gsw.select('transition');
GSW 映像包含有关过渡类编号和名称的元数据,以及用于设置过渡类样式的默认调色板。将过渡层添加到地图后,系统会自动使用这些可视化参数。
在脚本的“地图图层”部分底部,添加以下语句,以添加显示过渡类的新地图图层:
代码编辑器 (JavaScript)
Map.setCenter(105.26, 11.2134, 9);     // Mekong River Basin, SouthEast Asia
Map.addLayer({
  eeObject: transition,
  name: 'Transition classes (1984-2015)',
});
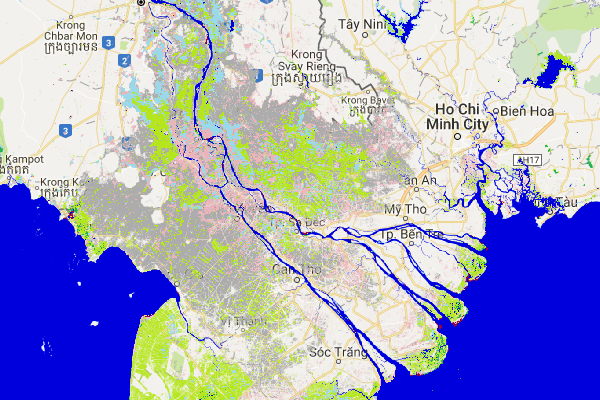
运行脚本后,系统会显示过渡层。

过渡类的地图键为:
| 值 | 符号 | 标签 |
|---|---|---|
| 0 | 不是水 | |
| 1 | 永久 | |
| 2 | 新永久 | |
| 3 | 永久丢失 | |
| 4 | 季节性 | |
| 5 | 新季节性 | |
| 6 | 丢失的季节性调整 | |
| 7 | 从季节性到永久性 | |
| 8 | 从永久性到季节性 | |
| 9 | 临时永久 | |
| 10 | 短暂季节性 |
按过渡类汇总面积
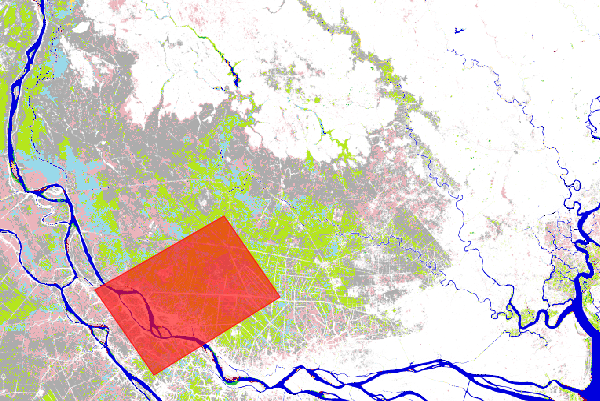
在本部分中,我们将再次使用几何多边形工具来定义感兴趣区域。如果您想分析新位置,请先选择并删除您绘制的原始多边形,以免获得合并区域的结果。如需了解如何修改几何图形,请参阅代码编辑器文档的 几何图形工具部分。
在此示例中,我们将在湄公河三角洲内绘制一个新多边形。

为了计算图像各部分覆盖的面积,我们将使用 ee.Image.pixelArea 方法向过渡图像对象添加一个额外的波段,用于标识每个像素的大小(以平方米为单位)。
代码编辑器 (JavaScript)
var area_image_with_transition_class = ee.Image.pixelArea().addBands(transition);
生成的影像对象 (area_image_with_transition_class) 是一个双波段影像,其中第一个波段包含以平方米为单位的面积信息(由
ee.Image.pixelArea代码>
方法生成),第二个波段包含过渡类信息。
然后,我们使用
ee.Image.reduceRegion
方法和
分组的归约函数
(用于对每个过渡类中的面积求和)来汇总感兴趣区域 (roi) 内的类过渡:
代码编辑器 (JavaScript)
var reduction_results = area_image_with_transition_class.reduceRegion({
  reducer: ee.Reducer.sum().group({
    groupField: 1,
    groupName: 'transition_class_value',
  }),
  geometry: roi,
  scale: 30,
  bestEffort: true,
});
print('reduction_results', reduction_results);
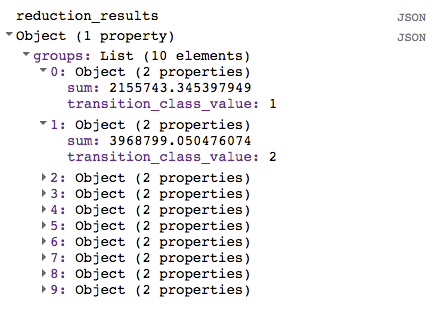
控制台标签页输出现在显示 reduction_results。请注意,您需要将树展开几个级别才能看到区域摘要数据。

虽然 reduction_results 对象确实包含有关每个过渡类所覆盖区域的信息,但这些信息并不容易解读。在下一部分中,我们将让结果更易于查看。
创建摘要图表
在本部分中,我们将制作一个图表,以便更好地总结结果。 首先,我们提取出具有区域的过渡类列表,如下所示:
代码编辑器 (JavaScript)
var roi_stats = ee.List(reduction_results.get('groups'));
分组缩减器 (reduction_results) 的结果是一个包含字典列表的字典。
列表中的每个字典都对应一个过渡类。
这些语句使用
ee.Dictionary.get
方法从该字典中提取分组的精简器结果,并将结果转换为 ee.List 数据类型,以便我们可以访问各个字典。
为了使用 代码编辑器的图表函数,我们将构建一个包含必要信息的 FeatureCollection。为此,我们首先创建两个查找字典和两个辅助函数。用于创建查找字典的代码可以放置在“计算”部分的顶部,如下所示:
代码编辑器 (JavaScript)
//////////////////////////////////////////////////////////////
// Calculations
//////////////////////////////////////////////////////////////

// Create a dictionary for looking up names of transition classes.
var lookup_names = ee.Dictionary.fromLists(
    ee.List(gsw.get('transition_class_values')).map(numToString),
    gsw.get('transition_class_names')
);
// Create a dictionary for looking up colors of transition classes.
var lookup_palette = ee.Dictionary.fromLists(
    ee.List(gsw.get('transition_class_values')).map(numToString),
    gsw.get('transition_class_palette')
);
lookup_names 字典将过渡类值与其名称相关联,而 lookup_palette 字典将过渡类值与颜色定义相关联。
这两个辅助函数可以放在名为“辅助函数”的新代码部分中。
代码编辑器 (JavaScript)
//////////////////////////////////////////////////////////////
// Helper functions
//////////////////////////////////////////////////////////////

// Create a feature for a transition class that includes the area covered.
function createFeature(transition_class_stats) {
  transition_class_stats = ee.Dictionary(transition_class_stats);
  var class_number = transition_class_stats.get('transition_class_value');
  var result = {
      transition_class_number: class_number,
      transition_class_name: lookup_names.get(class_number),
      transition_class_palette: lookup_palette.get(class_number),
      area_m2: transition_class_stats.get('sum')
  };
  return ee.Feature(null, result);   // Creates a feature without a geometry.
}

// Create a JSON dictionary that defines piechart colors based on the
// transition class palette.
// https://developers.google.com/chart/interactive/docs/gallery/piechart
function createPieChartSliceDictionary(fc) {
  return ee.List(fc.aggregate_array("transition_class_palette"))
    .map(function(p) { return {'color': p}; }).getInfo();
}

// Convert a number to a string. Used for constructing dictionary key lists
// from computed number objects.
function numToString(num) {
  return ee.Number(num).format();
}
函数 createFeature 接受一个字典(包含面积和水体过渡类别),并返回适合用于图表的 Feature。
函数 createPieChartSliceDictionary 会创建一个与过渡类对应的颜色列表,该列表采用饼图所需的格式。
接下来,我们将使用 ee.List.map 对列表 (roi_stats) 中的每个字典应用 createFeature 函数,以将辅助函数应用于列表的每个元素。
代码编辑器 (JavaScript)
var transition_fc = ee.FeatureCollection(roi_stats.map(createFeature));
print('transition_fc', transition_fc);
现在,我们有了一个包含要在图表上显示的属性的 FeatureCollection,接下来可以创建一个图表对象并将其输出到控制台。
代码编辑器 (JavaScript)
// Add a summary chart.
var transition_summary_chart = ui.Chart.feature.byFeature({
    features: transition_fc,
    xProperty: 'transition_class_name',
    yProperties: ['area_m2', 'transition_class_number']
  })
  .setChartType('PieChart')
  .setOptions({
    title: 'Summary of transition class areas',
    slices: createPieChartSliceDictionary(transition_fc),
    sliceVisibilityThreshold: 0  // Don't group small slices.
  });
print(transition_summary_chart);
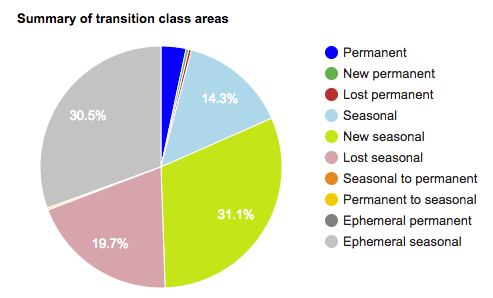
slices 选项用于为饼图切片着色,使其使用为过渡类定义的默认调色板(如地图键值表前面所示)。
sliceVisibilityThreshold 选项可防止将小切片归为“其他”类别。
生成的图表应与图 13 中显示的类似。

最终脚本
此部分的完整脚本如下:
代码编辑器 (JavaScript)
//////////////////////////////////////////////////////////////
// Asset List
//////////////////////////////////////////////////////////////

var gsw = ee.Image('JRC/GSW1_0/GlobalSurfaceWater');
var occurrence = gsw.select('occurrence');
var change = gsw.select("change_abs");
var transition = gsw.select('transition');
var roi = ee.Geometry.Polygon(
        [[[105.531921, 10.412183],
          [105.652770, 10.285193],
          [105.949401, 10.520218],
          [105.809326, 10.666006]]]);
//////////////////////////////////////////////////////////////
// Constants
//////////////////////////////////////////////////////////////

var VIS_OCCURRENCE = {
    min: 0,
    max: 100,
    palette: ['red', 'blue']
};
var VIS_CHANGE = {
    min: -50,
    max: 50,
    palette: ['red', 'black', 'limegreen']
};
var VIS_WATER_MASK = {
  palette: ['white', 'black']
};

//////////////////////////////////////////////////////////////
// Helper functions
//////////////////////////////////////////////////////////////

// Create a feature for a transition class that includes the area covered.
function createFeature(transition_class_stats) {
  transition_class_stats = ee.Dictionary(transition_class_stats);
  var class_number = transition_class_stats.get('transition_class_value');
  var result = {
      transition_class_number: class_number,
      transition_class_name: lookup_names.get(class_number),
      transition_class_palette: lookup_palette.get(class_number),
      area_m2: transition_class_stats.get('sum')
  };
  return ee.Feature(null, result);   // Creates a feature without a geometry.
}

// Create a JSON dictionary that defines piechart colors based on the
// transition class palette.
// https://developers.google.com/chart/interactive/docs/gallery/piechart
function createPieChartSliceDictionary(fc) {
  return ee.List(fc.aggregate_array("transition_class_palette"))
    .map(function(p) { return {'color': p}; }).getInfo();
}

// Convert a number to a string. Used for constructing dictionary key lists
// from computed number objects.
function numToString(num) {
  return ee.Number(num).format();
}

//////////////////////////////////////////////////////////////
// Calculations
//////////////////////////////////////////////////////////////

// Create a dictionary for looking up names of transition classes.
var lookup_names = ee.Dictionary.fromLists(
    ee.List(gsw.get('transition_class_values')).map(numToString),
    gsw.get('transition_class_names')
);
// Create a dictionary for looking up colors of transition classes.
var lookup_palette = ee.Dictionary.fromLists(
    ee.List(gsw.get('transition_class_values')).map(numToString),
    gsw.get('transition_class_palette')
);

// Create a water mask layer, and set the image mask so that non-water areas
// are transparent.
var water_mask = occurrence.gt(90).mask(1);

// Generate a histogram object and print it to the console tab.
var histogram = ui.Chart.image.histogram({
  image: change,
  region: roi,
  scale: 30,
  minBucketWidth: 10
});
histogram.setOptions({
  title: 'Histogram of surface water change intensity.'
});
print(histogram);

// Summarize transition classes in a region of interest.
var area_image_with_transition_class = ee.Image.pixelArea().addBands(transition);
var reduction_results = area_image_with_transition_class.reduceRegion({
  reducer: ee.Reducer.sum().group({
    groupField: 1,
    groupName: 'transition_class_value',
  }),
  geometry: roi,
  scale: 30,
  bestEffort: true,
});
print('reduction_results', reduction_results);

var roi_stats = ee.List(reduction_results.get('groups'));

var transition_fc = ee.FeatureCollection(roi_stats.map(createFeature));
print('transition_fc', transition_fc);

// Add a summary chart.
var transition_summary_chart = ui.Chart.feature.byFeature({
    features: transition_fc,
    xProperty: 'transition_class_name',
    yProperties: ['area_m2', 'transition_class_number']
  })
  .setChartType('PieChart')
  .setOptions({
    title: 'Summary of transition class areas',
    slices: createPieChartSliceDictionary(transition_fc),
    sliceVisibilityThreshold: 0  // Don't group small slices.
  });
print(transition_summary_chart);

//////////////////////////////////////////////////////////////
// Initialize Map Location
//////////////////////////////////////////////////////////////

// Uncomment one of the following statements to center the map on
// a particular location.
// Map.setCenter(-90.162, 29.8597, 10);   // New Orleans, USA
// Map.setCenter(-114.9774, 31.9254, 10); // Mouth of the Colorado River, Mexico
// Map.setCenter(-111.1871, 37.0963, 11); // Lake Powell, USA
// Map.setCenter(149.412, -35.0789, 11);  // Lake George, Australia
Map.setCenter(105.26, 11.2134, 9);     // Mekong River Basin, SouthEast Asia
// Map.setCenter(90.6743, 22.7382, 10);   // Meghna River, Bangladesh
// Map.setCenter(81.2714, 16.5079, 11);   // Godavari River Basin Irrigation Project, India
// Map.setCenter(14.7035, 52.0985, 12);   // River Oder, Germany & Poland
// Map.setCenter(-59.1696, -33.8111, 9);  // Buenos Aires, Argentina
// Map.setCenter(-74.4557, -8.4289, 11);  // Ucayali River, Peru

//////////////////////////////////////////////////////////////
// Map Layers
//////////////////////////////////////////////////////////////

Map.addLayer({
  eeObject: water_mask,
  visParams: VIS_WATER_MASK,
  name: '90% occurrence water mask',
  shown: false
});
Map.addLayer({
  eeObject: occurrence.updateMask(occurrence.divide(100)),
  name: "Water Occurrence (1984-2015)",
  visParams: VIS_OCCURRENCE,
  shown: false
});
Map.addLayer({
  eeObject: change,
  visParams: VIS_CHANGE,
  name: 'occurrence change intensity',
  shown: false
});
Map.addLayer({
  eeObject: transition,
  name: 'Transition classes (1984-2015)',
});
有关全球地表水数据集的教程到此结束。请注意,本教程仅展示了如何使用全球地表水数据集中的三个数据层(发生、变化强度和过渡)。您可以参阅 数据用户指南 (v2),了解其他可用的数据层。
祝您的分析工作一切顺利!
