Search Console とデータポータルを接続する
コレクションでコンテンツを整理
必要に応じて、コンテンツの保存と分類を行います。
2022 年 3 月 8 日(火曜日)
Google Search Console を使用すると、Google 検索でのウェブサイトのパフォーマンスを把握できますが、データを理解することは容易ではありません。データ視覚化を使って、自分のウェブサイトに役立つカスタム ダッシュボードを設定すれば、データに基づくより的確な意思決定ができるようになります。この投稿は、Google データポータルを使用した Search Console データのエクスポート、強化、視覚化に焦点を当てた一連の記事の最初の投稿です。
今回の投稿では、Search Console のデータを Google データポータルに取り込む方法について説明します。Search Console のデータを Google スプレッドシートにダウンロードし、データを地域別に強化して、スプレッドシートをデータポータルに接続する方法の例を紹介します。
今後の投稿では、データを視覚化してデータのモニタリングと分析に活用する方法について説明します。
データを準備してデータポータルに接続する
Search Console のデータをデータポータルにインポートするには、次の 2 つの方法があります。
- Search Console に表示されるデータと同じデータを表示する場合は、Google データポータルのデータコネクタを使用します。この方法は簡単で、コネクタ ギャラリーにアクセスし [Search Console] を選択して、接続するプロパティを見つけます。コネクタのガイドについては、データポータル ヘルプセンターをご覧ください。
- Search Console から提供されるデータを強化する場合(国を地域別にクラスタ化する場合など)は、まずウェブ インターフェースまたは API からデータをエクスポートします。その後、Google スプレッドシートまたは BigQuery でデータを処理し、データポータルに接続します。
この投稿では、2 つ目の方法について説明します。2 つ目の方法は必要な手順が多く、よりカスタマイズが可能です。主に、次の 3 つの手順を実施する必要があります。
- Search Console データをエクスポートする。
- そのデータに独自のデータを追加する。
- そのデータをデータポータルにインポートする。
Search Console データをエクスポートする
データをエクスポートするには、Search Console の検索パフォーマンス レポートにアクセスして、期間を選択し、[エクスポート] をクリックして、[Google スプレッドシート] を選択します。これで新しいスプレッドシートが作成されます。これを次のステップで強化します。Search Analytics API を使って、より自動化されたソリューションも可能ですが、この投稿では説明しません。
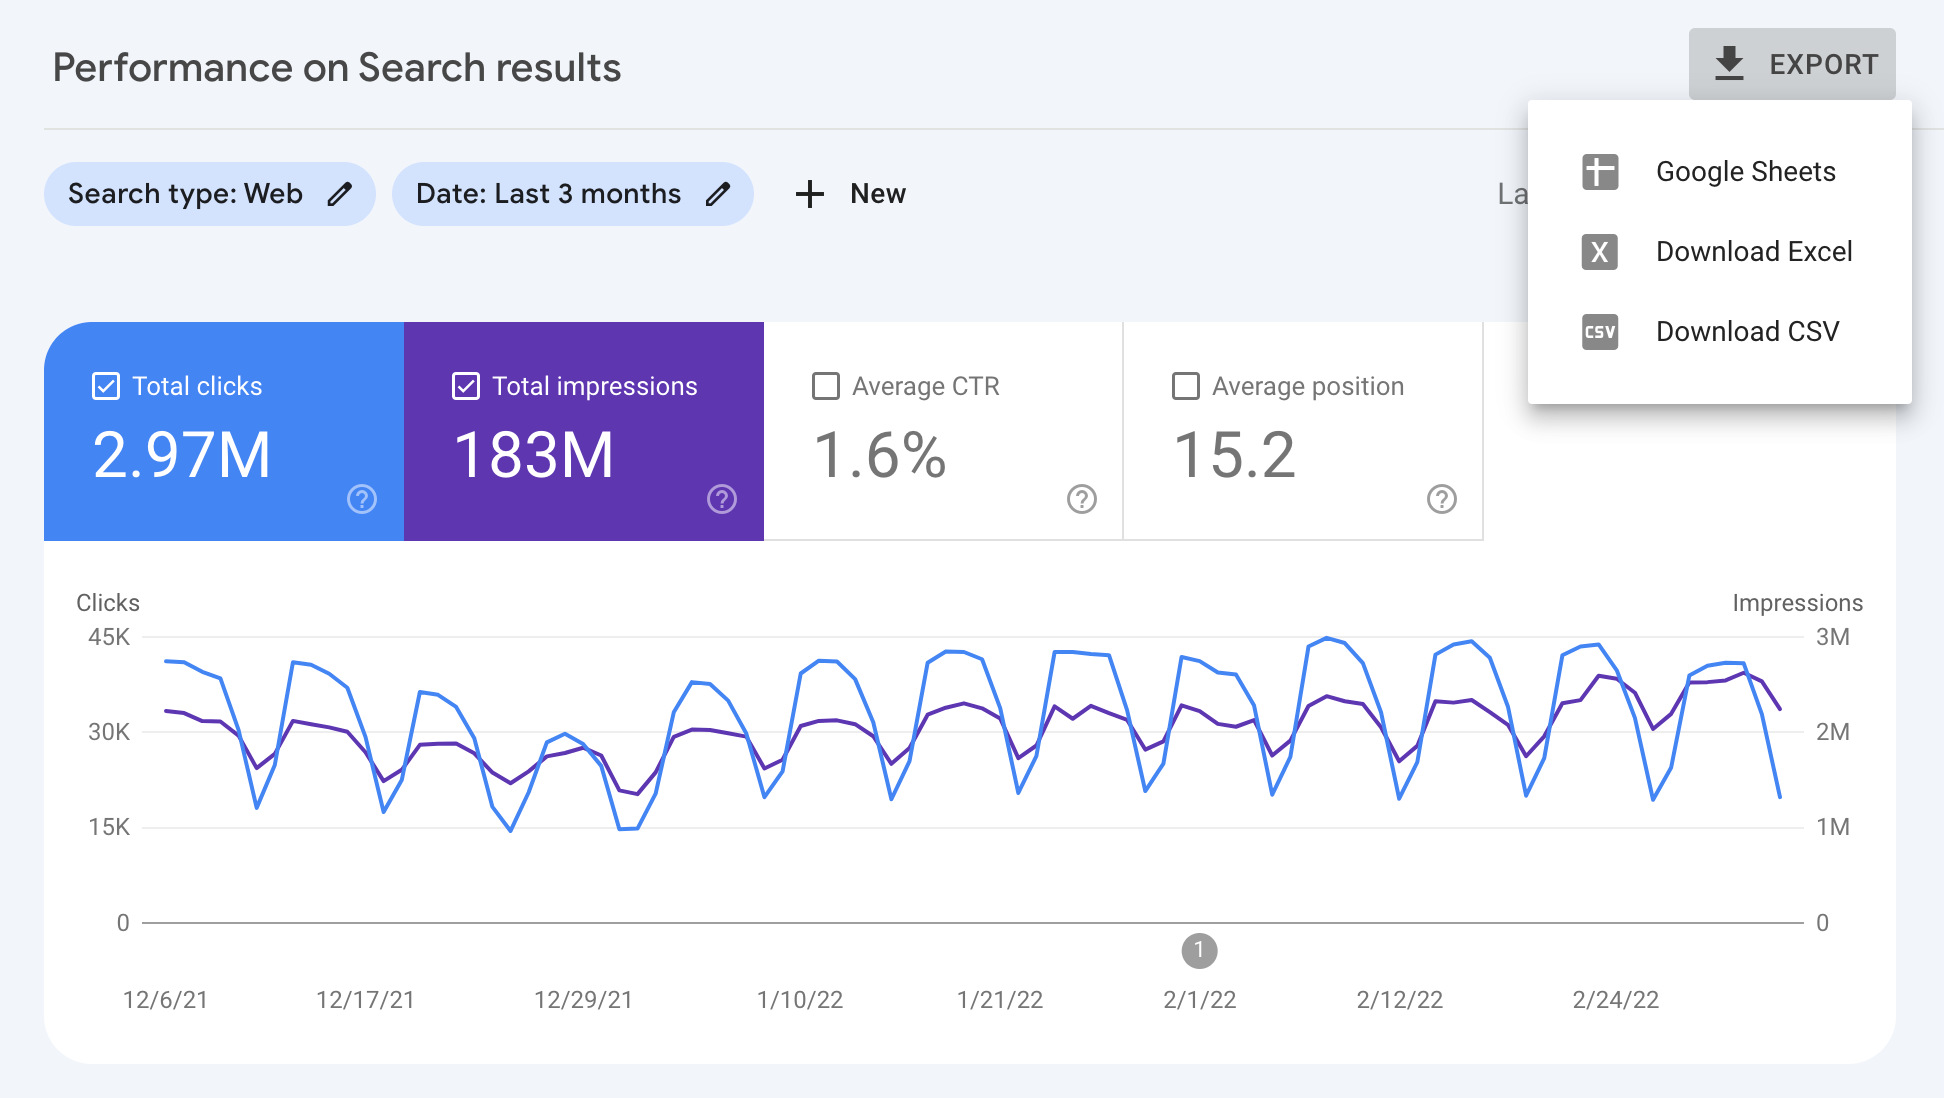
利用可能なディメンションと指標について詳しくは、検索パフォーマンス レポートのヘルプ ドキュメントをご覧ください。
Search Console データを強化する
Search Console データを強化する方法を説明するにあたり、簡単な Google スプレッドシート関数である IMPORTDATA を使用します。この関数で URL からデータをインポートします。この例では、ISO 3166 の国 / 地域の表をインポートします。
Search Console からエクスポートしたデータに新しいシートを追加し、最初のセルに次のコードを入力します。
=IMPORTDATA("https://gist.githubusercontent.com/richjenks/15b75f1960bc3321e295/raw/62749882ed0e9dffa3edd7a9a44a7be59df8402c/countries.md", "|")
Search Console シートで、[地域] の列を作成し、VLOOKUP
関数を使ってそれらの地域と国をマッチングします。
最終的な表の構成については、サンプルシートをご覧ください。
埋め込み: 国と地域別に強化された Search Console データを示す表
この例では地域データの強化を行いましたが、同じ手順であらゆるタイプの情報を追加できます。たとえば、クエリの分類がある場合は、それを使用してクエリをカテゴリに分類できます。
Google スプレッドシートをデータポータルに接続する
最後に、Google スプレッドシートをデータポータルに接続します。これを行うには、コネクタ ギャラリーで [Google スプレッドシート] を選択し、新しく作成したスプレッドシートを見つけます。必ず該当するシートを選択するようにしてください。
データがデータポータルに取り込まれると、視覚化処理が開始されます。
次の投稿
このシリーズの次の投稿である、データポータルを使用して検索トラフィックなどをモニタリングするでは、さまざまなタイプのダッシュボードについて説明し、詳細な例に従って進められるようにします。
ご不明な点がありましたら、Google 検索セントラル コミュニティまたはデータポータル コミュニティまでお問い合わせください。また、Twitter を使用している場合は、ぜひ Google をフォローしてください。今後の投稿について Twitter でお知らせいたします。引き続きご注目ください。
投稿者: Daniel Waisberg(検索アドボケイト)
特に記載のない限り、このページのコンテンツはクリエイティブ・コモンズの表示 4.0 ライセンスにより使用許諾されます。コードサンプルは Apache 2.0 ライセンスにより使用許諾されます。詳しくは、Google Developers サイトのポリシーをご覧ください。Java は Oracle および関連会社の登録商標です。
[null,null,[],[[["\u003cp\u003eThis post explains how to export, enhance, and visualize Search Console data using Google Data Studio for better website performance analysis.\u003c/p\u003e\n"],["\u003cp\u003eYou can directly connect Search Console to Data Studio or enhance the data by exporting it to Google Sheets for adding custom information like geographical regions.\u003c/p\u003e\n"],["\u003cp\u003eThis post focuses on enhancing Search Console data in Google Sheets by adding geographical regions using IMPORTDATA and VLOOKUP functions and then connecting it to Data Studio.\u003c/p\u003e\n"],["\u003cp\u003eFuture posts will cover creating data visualizations in Data Studio for monitoring and analyzing your website's search traffic data.\u003c/p\u003e\n"],["\u003cp\u003eEngage with the Google Search Central or Data Studio communities for questions and follow Google Search Central on Twitter for future updates.\u003c/p\u003e\n"]]],["This guide details how to enhance and visualize Google Search Console data in Google Data Studio. It outlines two methods for importing data: directly via the Data Studio connector or by first exporting and manipulating the data. The preferred method involves exporting Search Console data to Google Sheets, enriching it (e.g., adding geographical regions using the `IMPORTDATA` and `VLOOKUP` functions), and then connecting the enhanced spreadsheet to Data Studio for custom visualizations. The next steps include monitoring the data using Data studio.\n"],null,["# Connecting Search Console to Data Studio\n\nTuesday, March 08, 2022\n\n\n[Google Search Console](https://goo.gle/searchconsole) gives you insight into your website performance in Google Search,\nbut understanding your data can be a challenge. If you set up a custom dashboard with data visualizations that work for **you** , it might help you\nmake better decisions that are supported by data. This post is the first in a series of posts that will focus on exporting, enhancing, and visualizing\nSearch Console data using [Google Data Studio](https://support.google.com/datastudio/answer/6283323).\n\n\nIn today's post, we'll discuss how to bring your Search Console data into Google Data Studio. We'll show an example where we download Search Console data\ninto Google Sheets, enhance the data with geographical regions, and connect the spreadsheet to Data Studio.\n\n\nIn future posts, we'll discuss how to create data visualizations to help you monitor and analyze your data.\n\nPrepare the data and connect to Data Studio\n-------------------------------------------\n\n\nIn order to import Search Console data into Data Studio, there are two roads you can take:\n\n- If you are happy to see the same data as you see in Search Console, you should use the Google Data Studio data connector. This option is straightforward: visit the [connector gallery](https://datastudio.google.com/data), choose Search Console, and find the property you'd like to connect. You can find a guide to the connector in the [Data Studio Help Center](https://support.google.com/datastudio/answer/7314895).\n- If you'd like to enhance the data provided by Search Console (for example, clustering countries into regions), you should first export the data from the web interface or through the API. Then, you can manipulate the data with Google Sheets or BigQuery and connect it to Data Studio.\n\n\nIn this post we'll discuss the second option, since it requires more steps and offers more customization opportunities. There are three main steps you need to take:\n\n1. Export Search Console data.\n2. Add your own data on top of it.\n3. Import it into Data Studio.\n\n### Export Search Console data\n\n\nIn order to export your data, visit the Search Console [Performance report](https://search.google.com/search-console/performance/search-analytics),\nchoose a date range, click **Export** , and choose Google Sheets. This will create a new spreadsheet, which we'll enhance in the next step. You can also use\nthe [Search Analytics API](/webmaster-tools/v1/searchanalytics/query) for a more automated solution, but that's\nout of scope for this post.\n\n\nYou can read more about the dimensions and metrics that will be available to you in the [Performance\nreport help documentation](https://support.google.com/webmasters/answer/7576553#dimensions).\n\n### Enhance Search Console data\n\n\nTo show how to enhance your Search Console data, we'll use a neat Google Sheets function, [IMPORTDATA](https://support.google.com/docs/answer/3093335),\nwhich can import data from a URL. In our example, we're importing the\n[ISO 3166 countries by region](https://gist.githubusercontent.com/richjenks/15b75f1960bc3321e295/raw/62749882ed0e9dffa3edd7a9a44a7be59df8402c/countries.md) table.\n\n\nAdd a new sheet to the data you exported from Search Console and enter the following code to the first cell: \n\n```text\n=IMPORTDATA(\"https://gist.githubusercontent.com/richjenks/15b75f1960bc3321e295/raw/62749882ed0e9dffa3edd7a9a44a7be59df8402c/countries.md\", \"|\")\n```\n\n\nIn the Search Console sheet, create a column for **Region** and use the [VLOOKUP](https://support.google.com/docs/answer/3093318)\nfunction to match the regions to the countries.\n\n\nHere is a [sample sheet](https://docs.google.com/spreadsheets/d/1WoyovWWCLq9uaYfnsICL4uMQMApaoNhjMf8U4nl0ZHQ/) showing how the final table would look.\n\n\n*Embedded: Table showing Search Console data enhanced with country regions*\n\n\nEven though we're using an example to enhance the geographical data, you can use the same process to add any type of information. For example, if you have a query classification,\nyou could use that to group queries into categories.\n\n### Connect Google Sheets to Data Studio\n\n\nFinally, connect your Google Sheets to Data Studio. To do this, visit the [connector gallery](https://datastudio.google.com/data),\nchoose Google Sheets, and find your newly created spreadsheet; but make sure to choose the right sheet.\n\n\nOnce the data is in Data Studio, the visualization work begins...\n\nNext\n----\n\n\nIn the next post in this series, [Monitoring Search traffic (and more!) with Data Studio](/search/blog/2022/03/monitoring-dashboard), we'll discuss different types of dashboards and provide step-by-step examples for you to follow along.\n\n\nAs always, let us know if you have any questions through the [Google\nSearch Central Community](https://support.google.com/webmasters/threads?thread_filter=(category:search_console)) or the [Data Studio Community](https://support.google.com/datastudio/threads?thread_filter=(category:connect_to_data)).\nAlso, if you're on Twitter, make sure to [follow us](https://twitter.com/googlesearchc); we'll announce future posts over there - *stay tuned!*\n\nPosted by [Daniel Waisberg](https://www.danielwaisberg.com), Search Advocate"]]