データポータルを使用して検索トラフィックなどをモニタリングする
コレクションでコンテンツを整理
必要に応じて、コンテンツの保存と分類を行います。
2022 年 3 月 30 日(水曜日)
この記事では、データポータルで検索トラフィック用のモニタリング ダッシュボードを作成する方法について説明します。Search Console にもすぐに使えるグラフとフィルタ機能がありますが、データポータルでは、独自のグラフをカスタマイズして、Google 広告、アナリティクス、YouTube、BigQuery などの他のツールのデータと並べて表示できます。このシリーズの以前の記事をまだ読んでいない方は、Search Console とデータポータルを接続するをご覧ください。
ダッシュボードの詳しい説明に入る前に、データポータルをご利用の方にお知らせがあります。このたび Search Console コネクタに、最近追加されたデータと同様に、Discover と Google ニュースのトラフィックに関するデータが追加されました。
今回の投稿では、ご自身の独自データで使用できるダッシュボードを共有します。このダッシュボードでは、さまざまな Search Console のプロパティ、データの種類、デバイスなどを簡単に切り替えられます。ご自身のデータをこのテンプレートにリンクすることで、サイトの Google 検索トラフィックをモニタリングできます。
引き続きダッシュボードの詳細に関するこの記事をご覧ください。
ダッシュボードの使用方法と使用したほうがよい理由
ダッシュボードを作成する際にはまず、目的を定義することから始めます。たいていの場合、目的は次の 3 つに大別されます。
- パフォーマンスのモニタリング: サイト上の重要なページの URL クリック数とクリック率(CTR)のモニタリングなど、データの変化を迅速に把握します。
- データ探索: データからインサイトを引き出します。たとえば、国別、デバイス別、ウェブサイトのセクション別に検索のパフォーマンスのパターンを分析する場合などに使用できます。
- 情報発信: 業界別に分類した集計データなど、興味を引くトレンドやパターンを公開します。
この記事では、問題の発生を認識するうえで役に立つ、パフォーマンスをモニタリングするダッシュボードについて説明します。通常、このようなダッシュボードでは、ユーザーがすばやく理解できるように、折れ線グラフ、棒グラフ、表などのシンプルな可視化が使用されます。問題が見つかった場合は、SEO またはアナリストが詳しいデータ探索を開始できます(これについては、次の投稿で説明します)。
検索トラフィック モニタリング ダッシュボード
先ほど説明したとおり、この投稿では Google 検索のパフォーマンスをモニタリングする
テンプレートを共有します。このセクションでは、検索データをデータポータルに取り込む方法、ダッシュボードが提供する機能とデータ、Google が設計上の決定を行った背景について説明します。
Search Console コネクタをセットアップする
データポータルにログインして
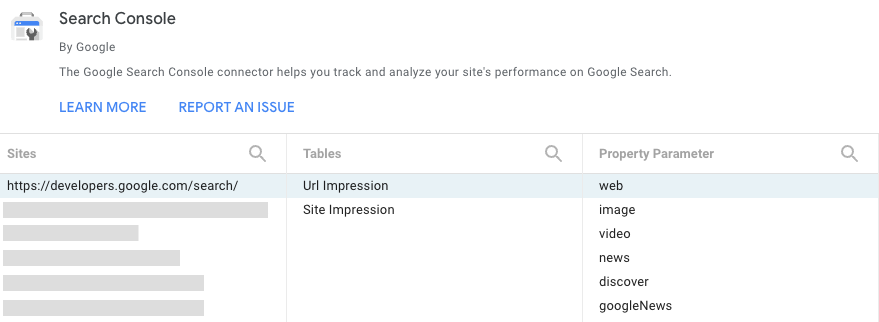
Search Console データソースを作成し、URL レベルベースのウェブ、画像、動画、ニュース、Discover、googleNews のデータを含む [
URL のインプレッション] 表を選択します。こちらで選択した
プロパティ パラメータがレポートのデフォルトになりますが、フィルタを利用することで他のパラメータにもアクセスできます。詳細については、この記事の後半をご覧ください。データの詳細については、
パフォーマンス レポートのヘルプページをご覧ください。
フィルタと日付を使用してデータを管理する
レポートのヘッダーには、グラフのデータをフィルタするオプションがいくつか含まれています。
- アクセス権を持っている別の Search Console プロパティに切り替えるには、データ管理オプションを使用します。
- レポートに含めるデータの期間を選択します。デフォルトでは、過去 28 日間とその前の 28 日間が比較されます。
- フィルタを作成してデータをドリルダウンします。
- ページ: ウェブサイトでのページ(複数選択可)の追加と除外に使用します。Search Console の場合と同じように、正規表現を使用できます。
- タイプ: さまざまなデータタイプ(Discover や Google ニュースなど)からタイプを選択します。一度に 1 つのみ選択できます。
- 国: 国(複数選択可)の追加と除外に使用します。
- デバイス: デバイス カテゴリ(複数選択可)の選択に使用します。
クリック数とクリック率の推移をモニタリングする
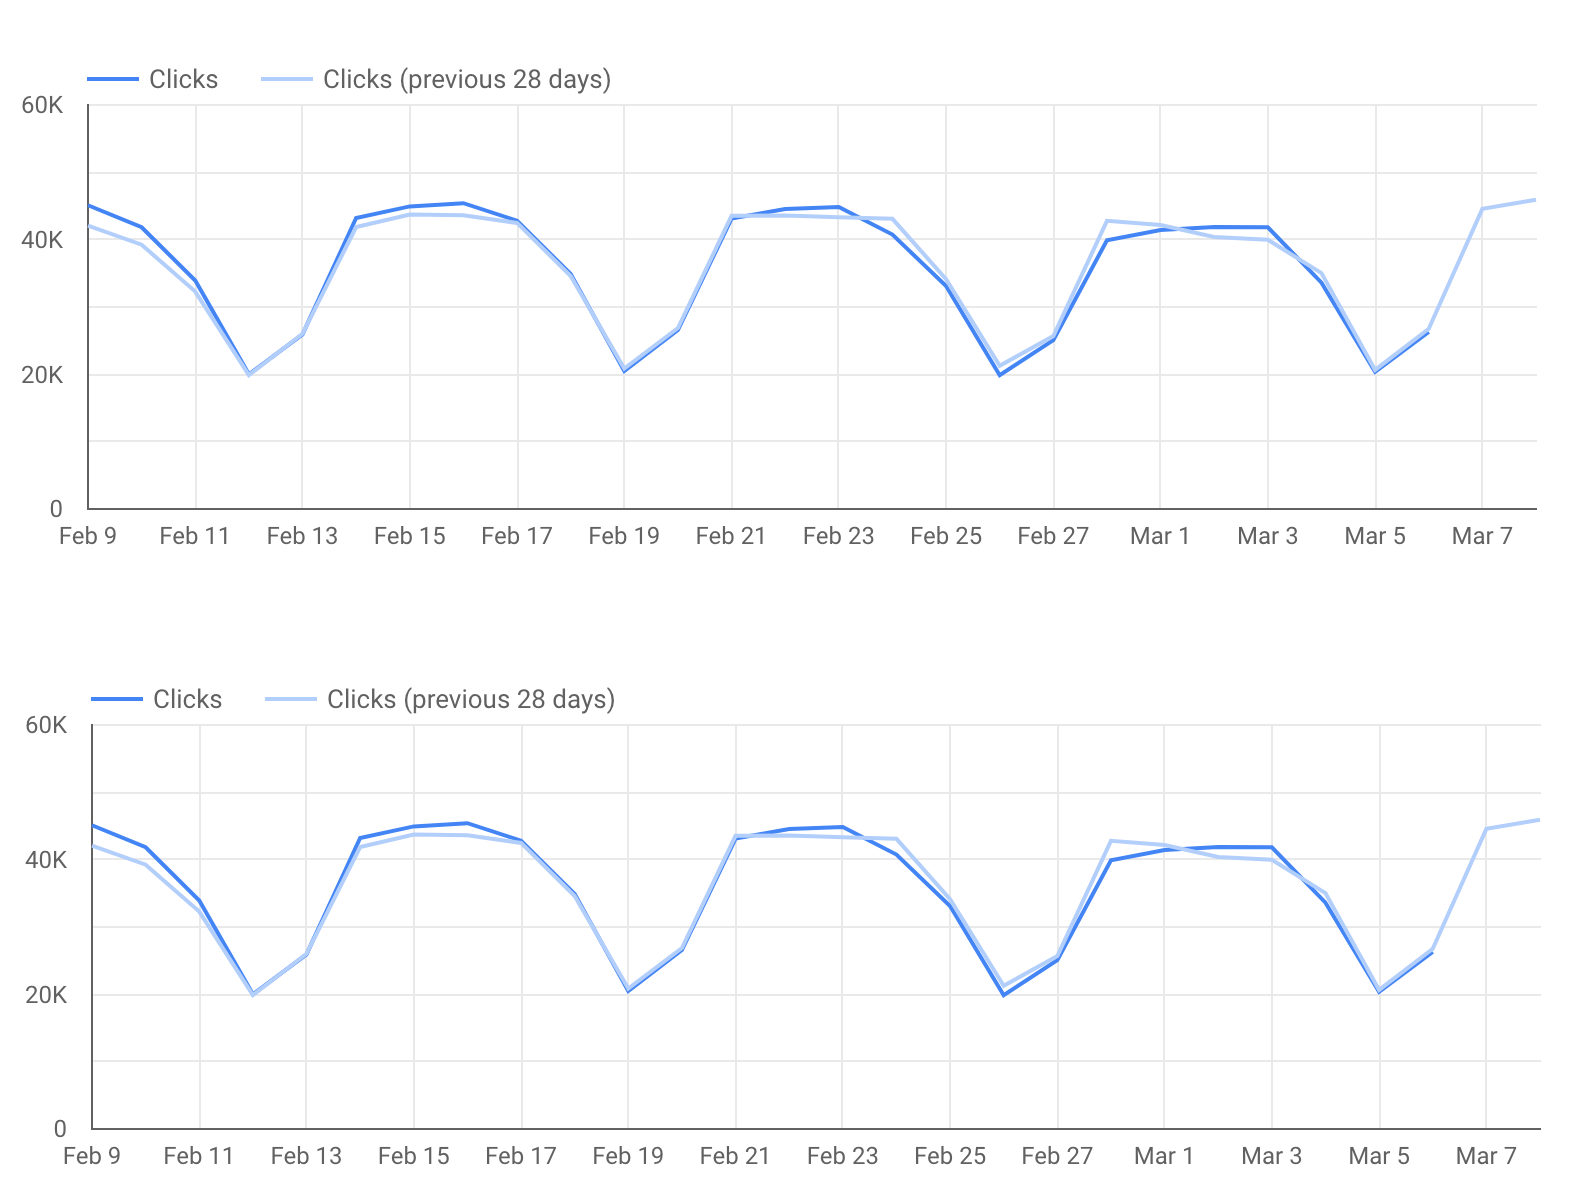
折れ線グラフは、時間の経過とともに指標がどのように変化しているかを示す最適な可視化方法です。今回はクリック数とサイトのクリック率の両方を確認します。折れ線グラフを見ると、週末と平日でパターンが大きく異なることがわかります(これは常に折れ線グラフの期間に 7 の倍数を使用することが重要である理由の一つです)。パターンに変化がある日を見逃さないようにしましょう。
なお、このグラフは仕事向けのウェブサイトのものであるため、トラフィックは平日に多く、週末には少なくなっていますが、ご自身のサイトのパターンはこれとは大きく異なる可能性があります。
このレポートに Google アナリティクスのデータは含まれていませんが、ウェブサイトが Google のオーガニック検索から獲得したコンバージョン数を示したグラフを含めることによって、興味深いインサイトが得られる場合があります。詳しくは、データポータルに Google アナリティクスを接続する方法をご確認ください。
特定の URL(ウェブサイトのセクション)にドリルダウンする
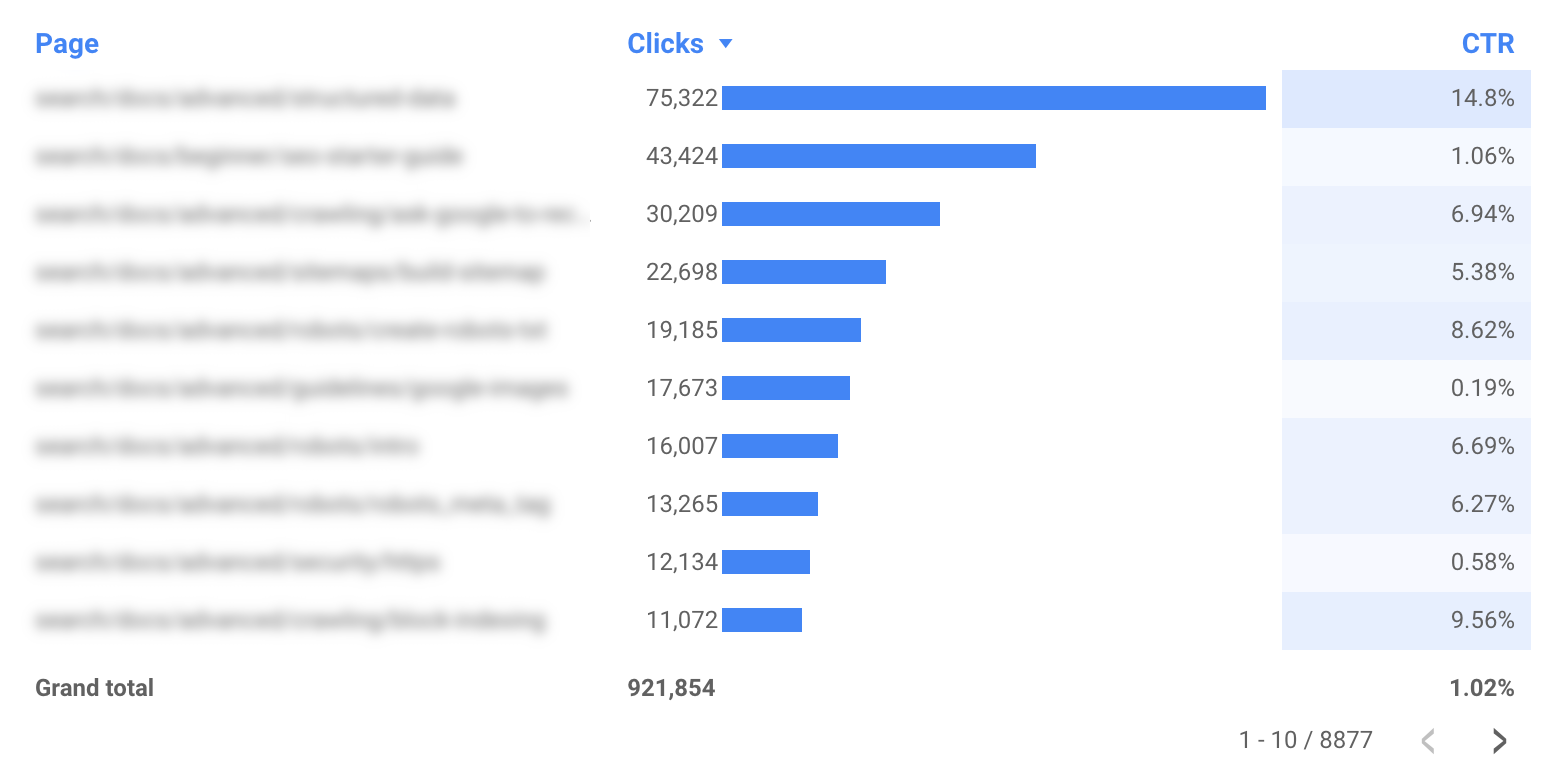
グラフはトレンドやパターンの分析に役立ちますが、より詳細な情報を得るには、表を使用して特定の URL(または URL のグループ)を分析するほうが効果的です。たとえば次のような方法があります。
- ページのフィルタを使用すると、ウェブサイトの特定のセクションのみを含められます。
- 国のフィルタを使用すると、重要な国でのさまざまなページのパフォーマンスを確認できます。
- タイプのフィルタを使用すると、各データタイプの URL レベルのパフォーマンスを分析できます。
その他のヒント
ヒント 1: ダッシュボードをモバイル フレンドリーにする
通常、ダッシュボードはパソコン上で使用するため、モバイル フレンドリーにする必要はありません。しかし、モニタリング ダッシュボードは通勤中に使用することも多いため、モバイル フレンドリーにすることが重要な場合があります。
モバイル デバイスでのモニタリング ダッシュボードのエクスペリエンスを改善するには、[表示モード] を [幅に合わせる](レポートとページ レイアウトの下にあります)に設定し、画面サイズに合わせてダッシュボードの幅が調整されるようにします。このオプションを選択する場合は、各画面サイズでレポートがどのように表示されるかを必ず確認してください。
ヒント 2: URL 文字列を短縮する
サブドメインのない単一のドメインをレポートに含める場合は、表を見やすくするためにドメイン名をレポートから削除することをおすすめします。たとえば、example.com/cool-dashboards/search
のレポートを作成している場合、表示されるのは /cool-dashboards/search
のみになります。このようにするには計算フィールドを作成し、正規表現を使って URL からドメイン名を削除します。たとえば、.com
ドメイン名の場合は、次の表現が使用できます。
REGEXP_EXTRACT(Landing Page, ".*\\.com/(.*)$")
次のステップ: 検索の最適化に役立つ高度なグラフ
次の投稿である、Search Console のバブルチャートによるウェブサイトのパフォーマンスの最適化では、検索を最適化する際に注目すべき点を把握するうえで役に立つ、高度なグラフについて説明します。
ご不明な点がありましたら、Google 検索セントラル コミュニティまたはデータポータル コミュニティまでお問い合わせください。また、Twitter を使用している場合はぜひ Google をフォローしてください。今後の投稿について随時お知らせしています。
ぜひデータポータルをご活用ください。
投稿者: Daniel Waisberg(検索アドボケイト)
特に記載のない限り、このページのコンテンツはクリエイティブ・コモンズの表示 4.0 ライセンスにより使用許諾されます。コードサンプルは Apache 2.0 ライセンスにより使用許諾されます。詳しくは、Google Developers サイトのポリシーをご覧ください。Java は Oracle および関連会社の登録商標です。
[null,null,[],[[["\u003cp\u003eThis article explains how to build a Data Studio dashboard to monitor website search traffic, including clicks, CTR, and performance by page, country, device, and search type.\u003c/p\u003e\n"],["\u003cp\u003eThe provided dashboard template allows users to connect their own Search Console data for analysis and visualization.\u003c/p\u003e\n"],["\u003cp\u003eThe dashboard focuses on monitoring performance, enabling users to quickly identify and address changes in search traffic patterns.\u003c/p\u003e\n"],["\u003cp\u003eData Studio's Search Console connector now includes Discover and Google News traffic data, enhancing the scope of analysis.\u003c/p\u003e\n"],["\u003cp\u003eThe article also offers tips on making the dashboard mobile-friendly and shortening URL strings for improved readability.\u003c/p\u003e\n"]]],["This article details creating a Google Search traffic monitoring dashboard in Data Studio. It explains how to use a provided template to track Search Console data, including web, image, video, news, Discover, and Google News traffic. Key actions include setting up a Search Console connector, using filters (page, type, country, device), and analyzing clicks and click-through rates (CTR) over time via line charts. It also emphasizes mobile-friendly design and URL shortening tips. The core function of this dashboard is to monitor performance for quick issue detection.\n"],null,["# Monitoring Search traffic (and more!) with Data Studio\n\nWednesday, March 30, 2022\n\n\nThis article shows how to create a monitoring dashboard for your Search traffic on Data Studio. While Search Console provides\nout-of-the-box charts and filtering capabilities, Data Studio allows you to customize your own charts and view them side\nby side with other data, such as Google Ads, Analytics, YouTube, BigQuery, and others. If you missed our previous article\nin this series, check it out at [Connecting Search Console to Data Studio](/search/blog/2022/03/connecting-data-studio).\n\n\nBefore we dive into dashboarding, we have some good news for Data Studio users: *as of today, the Search Console connector includes\ndata for Discover and Google News traffic, similar to the data [recently\nadded](/search/blog/2021/10/search-analytics-discover-gnews) to the API*.\n\n\nIn today's post, we're sharing a dashboard for you to use with your own data; it makes it easy to toggle between different Search Console properties,\ndata types, devices, and more. You can link your own data to\n[this template](https://datastudio.google.com/reporting/7300a2df-97a2-408a-b10c-43acd2270fe6/page/6zXD/preview) to monitor\nyour site's Google Search traffic.\n\n\nKeep reading to learn more about the dashboard.\n\nHow and why you should use a dashboard\n--------------------------------------\n\n\nWhen you build a dashboard, you should always start by defining its purpose,\nand the majority of cases can be classified as one of three options:\n\n- **Monitoring performance**. Quickly discover a change in the data, for example monitoring URL clicks and click-through rate (CTR) for important pages on your site.\n- **Data exploration**. Uncover insights from data, for example analyzing search performance patterns across different countries, devices, or website sections.\n- **Informing the world**. Publishing interesting trends and patterns, for example sharing aggregate data segmented by industry.\n\n\nToday we'll discuss a monitoring performance dashboard, which should help you find out issues as they happen. Usually, this kind\nof dashboard uses simple visualizations such as line or bar charts, and tables --- those are quick to interpret. Then, if an issue\nis discovered, the SEO or analyst can proceed to a deeper data exploration (this will be covered in the next post).\n\nSearch traffic monitoring dashboard\n-----------------------------------\n\nAs mentioned, this post provides [a template](https://datastudio.google.com/reporting/7300a2df-97a2-408a-b10c-43acd2270fe6/page/6zXD/preview) to monitor Google Search performance. In this section, we discuss how to get your Search data into Data Studio, what functionality and data the dashboard provides, and why we made some of the design decisions.\n\n### Set up a Search Console connector\n\nSign in to [Data Studio](https://datastudio.google.com/), create a [Search Console data source](https://support.google.com/datastudio/answer/7314895), and choose the **URL Impression** table, which includes data for web, image, video, news, discover, and googleNews on a URL level basis. The **Property Parameter** you choose here will be the default one in your report, but you'll have access to the others through a filter, more about it later in the post. To learn more about the data visit the [Performance report help pages](https://support.google.com/webmasters/topic/9384513).\n\n\n### Control the data using filters and dates\n\n\nThe header of the report includes several options for you to filter the data in the charts:\n\n1. Use the [data control](https://support.google.com/datastudio/answer/7415591) to change between the Search Console properties you have access to.\n2. Choose the date range you'd like to see in the report. By default you'll see the last 28 days compared to the previous 28 days.\n3. Create filters to drill down on your data:\n - **Page** . Use this to include or exclude one or more pages from your website. Tip: you can [use regular expressions](/search/blog/2021/06/regex-negative-match) similar to the way you use it in Search Console.\n - **Type**. Use this to choose among the different data types (including Discover and Google News). You can only choose one at a time.\n - **Country**. Use this to include or exclude one or more countries.\n - **Device**. Use this to choose one or more device categories.\n\n\n### Monitor clicks and CTR over time\n\n\nA line chart is the most effective visualization to show how metrics change over time. In this case, we chose to look at both\nClicks and Site CTR. In the line chart image, weekends and weekdays have very different patterns (one of the reasons it's\nimportant to always use a multiple of 7 in your line charts date range) --- *keep your eyes on days that break that pattern!*\n\n\nNote that this image is for a website that is work oriented, hence the traffic is high on weekdays and low on weekends.\nIt might look very different for your site.\n\n\nWe have not included Google Analytics data in this report, but it might be interesting to include a chart showing how many conversions the\nwebsite got from organic Google Search. Learn how to [connect\nGoogle Analytics](https://support.google.com/datastudio/answer/6370352) to Data Studio; this would help closing the loop.\n\n### Drill down into specific URLs (or website sections)\n\n\nWhen you analyze trends and patterns, charts will be more helpful to you, but if you want to go deeper, it's more effective to analyze particular\nURLs (or groups of them) using a table. For example:\n\n- Use the page filter to include only specific sections of your website.\n- Use the country filter to check how different pages perform in countries you care about.\n- Use the type filter to analyze URL-level performance for each of the data types.\n\n\nBonus tips\n----------\n\n### Tip #1: Make your dashboard mobile-friendly\n\n\nMost dashboards don't need to be mobile friendly as people use them on their computer. But a monitoring dashboard can be often\nused while commuting to work, so it might be important for it to be mobile-friendly.\n\n\nIn order to create a good mobile experience for a monitoring dashboard, set \"Display mode\" to \"Fit to width\" (found under\n[report and page layout](https://support.google.com/datastudio/answer/7355651)) --- this will adjust the\ndashboard width to the screen size. If you choose this option, make sure to check how the report looks on different screen sizes.\n\n### Tip #2: Shorten URL strings\n\n\nIf your report includes a single domain with no subdomains, you might consider removing the domain name from your report\nto make the tables less cluttered. For example, if you're building a report for `example.com/cool-dashboards/search`,\nyou'd see only `/cool-dashboards/search`. To do so, you can create a\n[calculated field](https://support.google.com/datastudio/answer/6299685) to remove the domain name\nfrom the URL using a regular expression. For example, for a `.com` domain name you\ncould use the following expression: \n\n```scdoc\nREGEXP_EXTRACT(Landing Page, \".*\\\\.com/(.*)$\")\n```\n\nNext: An advanced chart for optimizing your Search efforts\n----------------------------------------------------------\n\n\nIn the next post, [Optimizing website performance with a Search Console bubble chart](/search/blog/2022/04/performance-optimization-bubble-chart), we'll discuss an advanced chart that may help you understand where to focus your attention when it comes to\noptimizing your Search efforts.\n\n\nAs always, let us know if you have any questions through the [Google\nSearch Central Community](https://support.google.com/webmasters/threads?thread_filter=(category:search_console)) or the [Data\nStudio Community](https://support.google.com/datastudio/threads?thread_filter=(category:connect_to_data)). Also, if you're on Twitter, make sure to [follow us](https://twitter.com/googlesearchc);\nwe'll announce future posts over there.\n\n\n*Happy dashboarding!*\n\nPosted by [Daniel Waisberg](https://www.danielwaisberg.com), Search Advocate"]]