 在 GitHub 上查看源代码
ee.Image 对象具有一组关系、条件和布尔值方法,用于构建决策表达式。这些方法的结果对于通过遮罩、开发分类地图和重新分配值来将分析限制在特定像素或区域非常有用。
关系运算符和布尔运算符
关系方法包括:
eq()、gt()、gte()、lt() 和 lte()
布尔方法包括:
Code Editor (JavaScript)
and()、or() 和 not()
Colab (Python)
And()、Or() 和 Not()
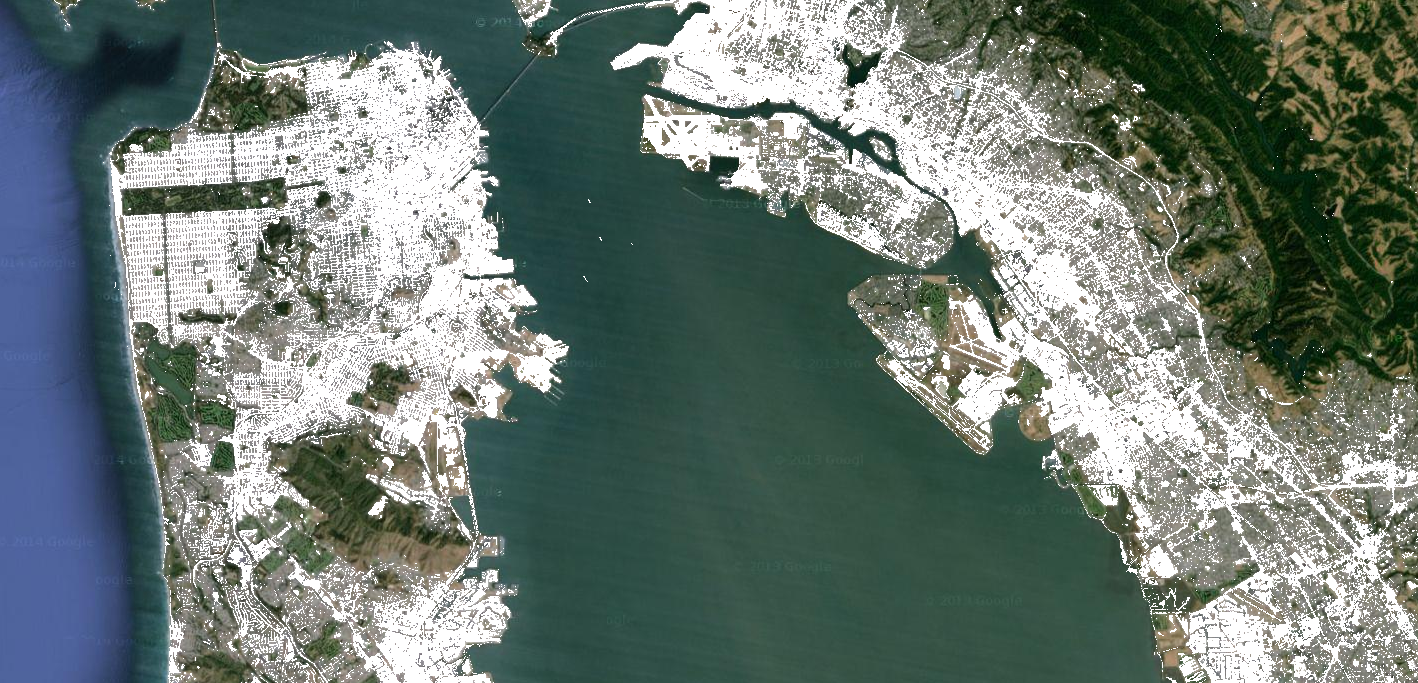
如需在图片之间执行按像素比较,请使用关系运算符。如需提取图像中的城市化区域,此示例使用关系运算符对光谱指数进行阈值化处理,并将阈值与 and 运算符结合使用:
Code Editor (JavaScript)
// Load a Landsat 8 image.
var image = ee.Image('LANDSAT/LC08/C02/T1_TOA/LC08_044034_20140318');

// Create NDVI and NDWI spectral indices.
var ndvi = image.normalizedDifference(['B5', 'B4']);
var ndwi = image.normalizedDifference(['B3', 'B5']);

// Create a binary layer using logical operations.
var bare = ndvi.lt(0.2).and(ndwi.lt(0));

// Mask and display the binary layer.
Map.setCenter(-122.3578, 37.7726, 12);
Map.setOptions('satellite');
Map.addLayer(bare.selfMask(), {}, 'bare');
import ee
import geemap.core as geemap
Colab (Python)
# Load a Landsat 8 image.
image = ee.Image('LANDSAT/LC08/C02/T1_TOA/LC08_044034_20140318')

# Create NDVI and NDWI spectral indices.
ndvi = image.normalizedDifference(['B5', 'B4'])
ndwi = image.normalizedDifference(['B3', 'B5'])

# Create a binary layer using logical operations.
bare = ndvi.lt(0.2).And(ndwi.lt(0))

# Define a map centered on San Francisco Bay.
map_bare = geemap.Map(center=[37.7726, -122.3578], zoom=12)

# Add the masked image layer to the map and display it.
map_bare.add_layer(bare.selfMask(), None, 'bare')
display(map_bare)
如此示例所示,关系运算符和布尔运算符的输出结果为 true (1) 或 false (0)。如需遮盖 0,您可以使用 selfMask() 将生成的二进制图片与自身进行遮盖。
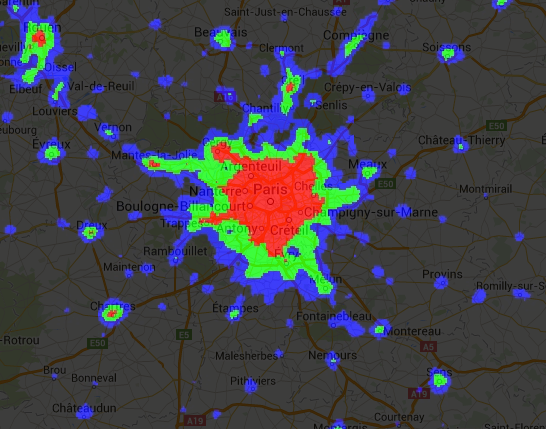
关系运算符和布尔运算符返回的二进制图片可以与数学运算符搭配使用。以下示例使用关系运算符和 add() 在夜间灯光图片中创建城市化区域:
Code Editor (JavaScript)
// Load a 2012 nightlights image.
var nl2012 = ee.Image('NOAA/DMSP-OLS/NIGHTTIME_LIGHTS/F182012');
var lights = nl2012.select('stable_lights');

// Define arbitrary thresholds on the 6-bit stable lights band.
var zones = lights.gt(30).add(lights.gt(55)).add(lights.gt(62));

// Display the thresholded image as three distinct zones near Paris.
var palette = ['000000', '0000FF', '00FF00', 'FF0000'];
Map.setCenter(2.373, 48.8683, 8);
Map.addLayer(zones, {min: 0, max: 3, palette: palette}, 'development zones');
import ee
import geemap.core as geemap
Colab (Python)
# Load a 2012 nightlights image.
nl_2012 = ee.Image('NOAA/DMSP-OLS/NIGHTTIME_LIGHTS/F182012')
lights = nl_2012.select('stable_lights')

# Define arbitrary thresholds on the 6-bit stable lights band.
zones = lights.gt(30).add(lights.gt(55)).add(lights.gt(62))

# Define a map centered on Paris, France.
map_zones = geemap.Map(center=[48.8683, 2.373], zoom=8)

# Display the thresholded image as three distinct zones near Paris.
palette = ['000000', '0000FF', '00FF00', 'FF0000']
map_zones.add_layer(
    zones, {'min': 0, 'max': 3, 'palette': palette}, 'development zones'
)
display(map_zones)
条件运算符
请注意,上例中的代码等同于使用 expression() 实现的三元运算符:
Code Editor (JavaScript)
// Create zones using an expression, display.
var zonesExp = nl2012.expression(
    "(b('stable_lights') > 62) ? 3" +
      ": (b('stable_lights') > 55) ? 2" +
        ": (b('stable_lights') > 30) ? 1" +
          ": 0"
);
Map.addLayer(zonesExp,
             {min: 0, max: 3, palette: palette},
             'development zones (ternary)');
import ee
import geemap.core as geemap
Colab (Python)
# Create zones using an expression, display.
zones_exp = nl_2012.expression(
    "(b('stable_lights') > 62) ? 3 "
    ": (b('stable_lights') > 55) ? 2 "
    ": (b('stable_lights') > 30) ? 1 "
    ': 0'
)

# Define a map centered on Paris, France.
map_zones_exp = geemap.Map(center=[48.8683, 2.373], zoom=8)

# Add the image layer to the map and display it.
map_zones_exp.add_layer(
    zones_exp, {'min': 0, 'max': 3, 'palette': palette}, 'zones exp'
)
display(map_zones_exp)
请注意,在上一个表达式示例中,使用 b() 函数(而非变量名称字典)引用感兴趣的频段。如需详细了解图片表达式,请参阅此页面。使用数学运算符或表达式都会产生相同的结果。
对图片实现条件操作的另一种方法是使用 where() 运算符。考虑是否需要将经过遮盖的像素替换为其他数据。在以下示例中,使用 where() 将多云像素替换为无云像素:
Code Editor (JavaScript)
// Load a cloudy Sentinel-2 image.
var image = ee.Image(
  'COPERNICUS/S2_SR/20210114T185729_20210114T185730_T10SEG');
Map.addLayer(image,
             {bands: ['B4', 'B3', 'B2'], min: 0, max: 2000},
             'original image');

// Load another image to replace the cloudy pixels.
var replacement = ee.Image(
  'COPERNICUS/S2_SR/20210109T185751_20210109T185931_T10SEG');

// Set cloudy pixels (greater than 5% probability) to the other image.
var replaced = image.where(image.select('MSK_CLDPRB').gt(5), replacement);

// Display the result.
Map.setCenter(-122.3769, 37.7349, 11);
Map.addLayer(replaced,
             {bands: ['B4', 'B3', 'B2'], min: 0, max: 2000},
             'clouds replaced');
import ee
import geemap.core as geemap
Colab (Python)
# Load a cloudy Sentinel-2 image.
image = ee.Image('COPERNICUS/S2_SR/20210114T185729_20210114T185730_T10SEG')

# Load another image to replace the cloudy pixels.
replacement = ee.Image(
    'COPERNICUS/S2_SR/20210109T185751_20210109T185931_T10SEG'
)

# Set cloudy pixels (greater than 5% probability) to the other image.
replaced = image.where(image.select('MSK_CLDPRB').gt(5), replacement)

# Define a map centered on San Francisco Bay.
map_replaced = geemap.Map(center=[37.7349, -122.3769], zoom=11)

# Display the images on a map.
vis_params = {'bands': ['B4', 'B3', 'B2'], 'min': 0, 'max': 2000}
map_replaced.add_layer(image, vis_params, 'original image')
map_replaced.add_layer(replaced, vis_params, 'clouds replaced')
display(map_replaced)