Page Summary
-
Use
image.reduceToVectors()in Earth Engine to convert raster data to vector data, creating polygons (or optionally centroids or bounding boxes) at the boundaries of connected, homogeneous pixels. -
The first band of the input image is used to identify homogeneous regions, while subsequent bands are reduced and added as properties to the output vectors.
-
It is good practice to specify the
geometry,scale, andcrsparameters when usingreduceToVectors()to control the extent and resolution of the output vectors. -
The
labelPropertyandreducerparameters can be used to add properties to the output vectors based on the zone labels and the reduction of specified bands.
To convert from an Image (raster) to a FeatureCollection
(vector) data type, use image.reduceToVectors(). This is the primary
mechanism for vectorization in Earth Engine, and can be useful for generating regions
for input to other types of reducer. The reduceToVectors() method
creates polygon edges (optionally centroids or bounding boxes instead) at the boundary of
homogeneous groups of connected pixels.
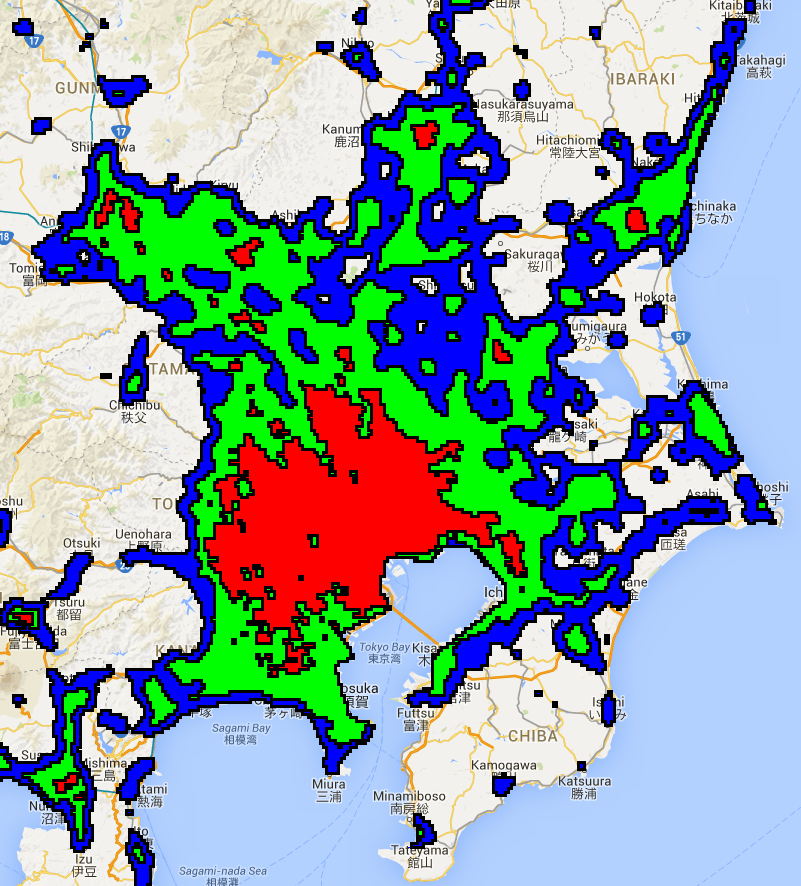
For example, consider a 2012 nightlights image of Japan. Let the nightlights digital
number serve as a proxy for development intensity. Define zones using arbitrary thresholds
on the nightlights, combine the zones into a single-band image, vectorize the zones using
reduceToVectors():
Code Editor (JavaScript)
// Load a Japan boundary from the Large Scale International Boundary dataset.
var japan = ee.FeatureCollection('USDOS/LSIB_SIMPLE/2017')
  .filter(ee.Filter.eq('country_na', 'Japan'));

// Load a 2012 nightlights image, clipped to the Japan border.
var nl2012 = ee.Image('NOAA/DMSP-OLS/NIGHTTIME_LIGHTS/F182012')
  .select('stable_lights')
  .clipToCollection(japan);

// Define arbitrary thresholds on the 6-bit nightlights image.
var zones = nl2012.gt(30).add(nl2012.gt(55)).add(nl2012.gt(62));
zones = zones.updateMask(zones.neq(0));

// Convert the zones of the thresholded nightlights to vectors.
var vectors = zones.addBands(nl2012).reduceToVectors({
  geometry: japan,
  crs: nl2012.projection(),
  scale: 1000,
  geometryType: 'polygon',
  eightConnected: false,
  labelProperty: 'zone',
  reducer: ee.Reducer.mean()
});

// Display the thresholds.
Map.setCenter(139.6225, 35.712, 9);
Map.addLayer(zones, {min: 1, max: 3, palette: ['0000FF', '00FF00', 'FF0000']}, 'raster');

// Make a display image for the vectors, add it to the map.
var display = ee.Image(0).updateMask(0).paint(vectors, '000000', 3);
Map.addLayer(display, {palette: '000000'}, 'vectors');
import ee
import geemap.core as geemap
Colab (Python)
# Load a Japan boundary from the Large Scale International Boundary dataset.
japan = ee.FeatureCollection('USDOS/LSIB_SIMPLE/2017').filter(
    ee.Filter.eq('country_na', 'Japan')
)

# Load a 2012 nightlights image, clipped to the Japan border.
nl_2012 = (
    ee.Image('NOAA/DMSP-OLS/NIGHTTIME_LIGHTS/F182012')
    .select('stable_lights')
    .clipToCollection(japan)
)

# Define arbitrary thresholds on the 6-bit nightlights image.
zones = nl_2012.gt(30).add(nl_2012.gt(55)).add(nl_2012.gt(62))
zones = zones.updateMask(zones.neq(0))

# Convert the zones of the thresholded nightlights to vectors.
vectors = zones.addBands(nl_2012).reduceToVectors(
    geometry=japan,
    crs=nl_2012.projection(),
    scale=1000,
    geometryType='polygon',
    eightConnected=False,
    labelProperty='zone',
    reducer=ee.Reducer.mean(),
)

# Display the thresholds.
m = geemap.Map()
m.set_center(139.6225, 35.712, 9)
m.add_layer(
    zones,
    {'min': 1, 'max': 3, 'palette': ['0000FF', '00FF00', 'FF0000']},
    'raster',
)

# Make a display image for the vectors, add it to the map.
display_image = ee.Image(0).updateMask(0).paint(vectors, '000000', 3)
m.add_layer(display_image, {'palette': '000000'}, 'vectors')
m
Note that the first band in the input is used to identify homogeneous regions and the
remaining bands are reduced according to the provided reducer, the output of which is
added as a property to the resultant vectors. The geometry parameter
specifies the extent over which the vectors should be created. In general, it is good
practice to specify a minimal zone over which to create vectors. It is also good practice
to specify the scale and crs to avoid ambiguity. The output type
is ‘polygon’ where the polygons are formed from homogeneous zones of
four-connected neighbors (i.e. eightConnected is false). The last two
parameters, labelProperty and reducer, specify that the output
polygons should receive a property with the zone label and the mean of the nightlights
band(s), respectively.
The mapped result should look something like the Tokyo area shown in Figure 1. Inspection of the output polygons indicates that each polygon has a property storing the label of the zone ({1, 2, 3}) and the mean of the nightlights band, since the mean reducer is specified.