연간 산림 손실 계산
이전 섹션에서는 reduceRegion 메서드를 사용하여 관심 지역에서 손실된 총 산림 면적을 계산하는 방법을 알아봤습니다. 총 손실을 계산하는 대신 연도별 손실을 계산하는 것이 좋습니다. Earth Engine에서 이를 달성하는 방법은 그룹화된 리듀서를 사용하는 것입니다.
reduceRegion()의 출력을 그룹화하려면 정수 픽셀 값으로 그룹을 정의하는 그룹화 대역을 지정하면 됩니다. 다음 예에서는 이전 코드를 약간 수정하고 lossYear 밴드를 원본 이미지에 추가합니다. lossYear 밴드의 각 픽셀에는 손실이 발생한 연도를 나타내는 0~14 값이 포함됩니다. 또한 리듀서를 그룹화된 리듀서로 변경하여 그룹화된 밴드의 밴드 색인 (1)을 지정하므로 픽셀 영역이 lossYear 밴드의 값에 따라 합산되고 그룹화됩니다.
코드 편집기 (JavaScript)
// Load country boundaries from LSIB.
var countries = ee.FeatureCollection('USDOS/LSIB_SIMPLE/2017');
// Get a feature collection with just the Congo feature.
var congo = countries.filter(ee.Filter.eq('country_co', 'CF'));

// Get the loss image.
// This dataset is updated yearly, so we get the latest version.
var gfc2017 = ee.Image('UMD/hansen/global_forest_change_2017_v1_5');
var lossImage = gfc2017.select(['loss']);
var lossAreaImage = lossImage.multiply(ee.Image.pixelArea());

var lossYear = gfc2017.select(['lossyear']);
var lossByYear = lossAreaImage.addBands(lossYear).reduceRegion({
  reducer: ee.Reducer.sum().group({
    groupField: 1
    }),
  geometry: congo,
  scale: 30,
  maxPixels: 1e9
});
print(lossByYear);
위의 코드를 실행하면 groups이라는 중첩 목록에 연간 산림 손실 면적이 출력됩니다. 결과를 사전으로 만들기 위해 출력을 약간 포맷할 수 있습니다. 연도를 키로, 손실 영역을 값으로 사용합니다. format() 메서드를 사용하여 연도 값을 0~14에서 2000~2014로 변환하고 있습니다.
코드 편집기 (JavaScript)
var statsFormatted = ee.List(lossByYear.get('groups'))
  .map(function(el) {
    var d = ee.Dictionary(el);
    return [ee.Number(d.get('group')).format("20%02d"), d.get('sum')];
  });
var statsDictionary = ee.Dictionary(statsFormatted.flatten());
print(statsDictionary);
차트 만들기
이제 연간 손실 수치가 있으므로 차트를 준비할 수 있습니다. ui.Chart.array.values() 메서드를 사용합니다. 이 메서드는 입력 값의 배열 (또는 목록)과 X축의 라벨 배열 (또는 목록)을 사용합니다.
코드 편집기 (JavaScript)
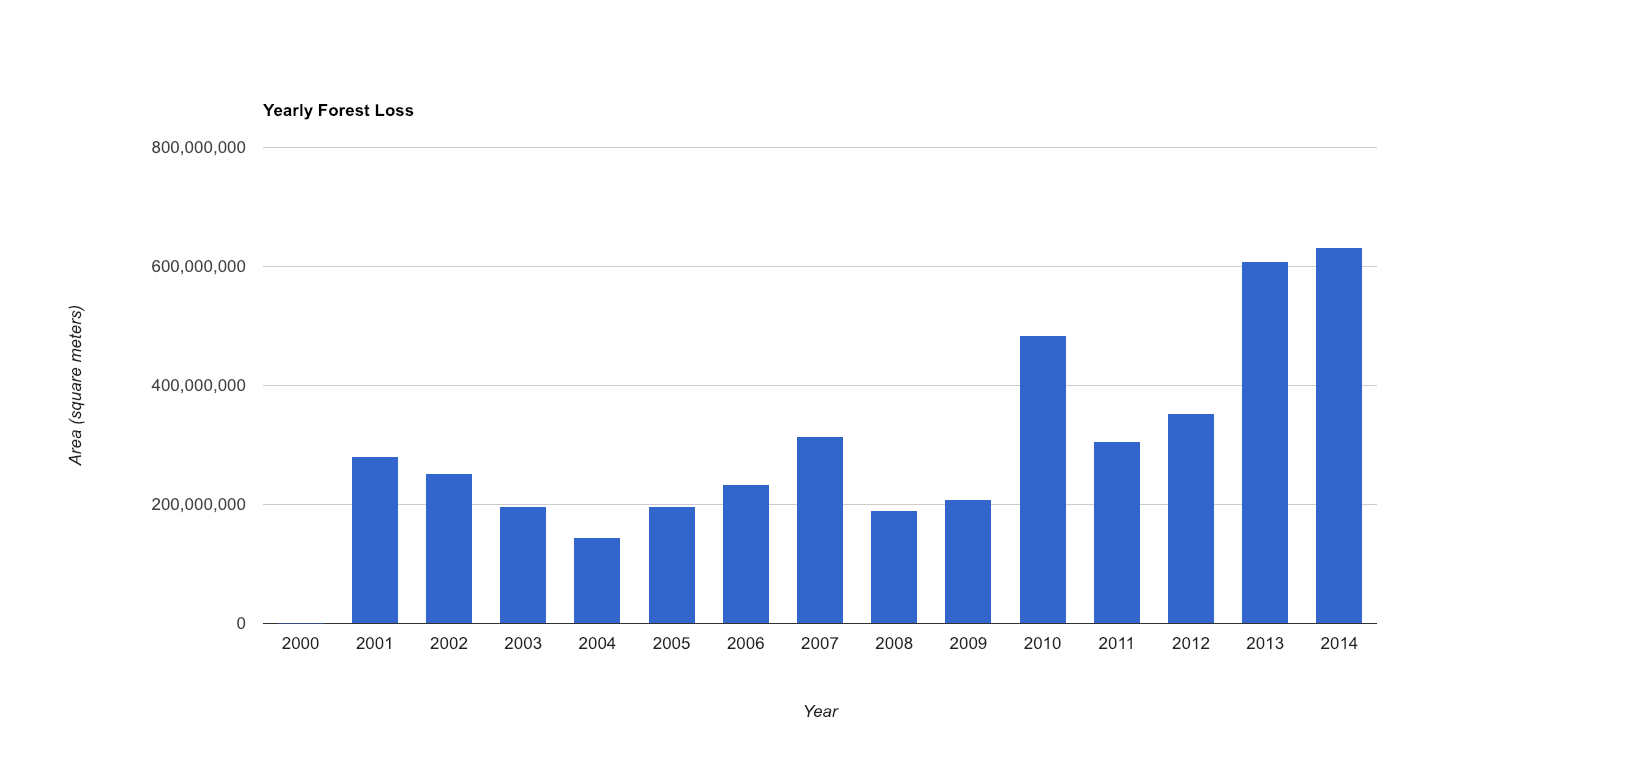
var chart = ui.Chart.array.values({
  array: statsDictionary.values(),
  axis: 0,
  xLabels: statsDictionary.keys()
}).setChartType('ColumnChart')
  .setOptions({
    title: 'Yearly Forest Loss',
    hAxis: {title: 'Year', format: '####'},
    vAxis: {title: 'Area (square meters)'},
    legend: { position: "none" },
    lineWidth: 1,
    pointSize: 3
  });
print(chart);
결과는 아래 차트와 같이 표시됩니다.
다음 섹션에서는 또 다른 삼림 벌채 모니터링 데이터 세트인 FORMA에 대해 알아보고 Hansen et al. 데이터와 비교합니다.