LinkedIn에서 Google 검색 확인하기:
LinkedIn에서 팔로우하고 검색 가능한 사이트를 만드는 방법에 관한 Google 검색 뉴스와 리소스를 확인하세요.
데이터 스튜디오에 Search Console 연결하기
컬렉션을 사용해 정리하기
내 환경설정을 기준으로 콘텐츠를 저장하고 분류하세요.
2022년 3월 8일 화요일
Google Search Console을 사용하면 Google 검색에서의 웹사이트 실적에 관한 유용한 정보가 제공되지만 데이터를 해석하기가 어려울 수 있습니다. 나에게 효과적인 데이터 시각화를 통해 맞춤 대시보드를 설정하면 데이터를 기반으로 한 더 나은 결정을 내릴 수 있습니다. 이 게시물은 Google 데이터 스튜디오를 사용하여 Search Console 데이터를 내보내고, 개선하고, 시각화하는 데 중점을 둔 시리즈 중 첫 번째입니다.
이번 게시물에서는 Search Console 데이터를 Google 데이터 스튜디오로 가져오는 방법을 알아보겠습니다. Search Console 데이터를 Google Sheets로 다운로드하고 지역 정보를 더해 데이터를 개선한 후 스프레드시트를 데이터 스튜디오에 연결하는 방법을 예시를 통해 보여 드리겠습니다.
이후 게시물에서는 데이터 모니터링 및 분석에 도움이 되는 시각 자료를 만드는 방법을 다룰 예정입니다.
데이터 준비 및 데이터 스튜디오에 연결하기
Search Console 데이터를 데이터 스튜디오로 가져오는 방법에는 두 가지가 있습니다.
- Search Console에 표시되는 것과 동일한 데이터를 가져오려면 Google 데이터 스튜디오 데이터 커넥터를 사용해야 합니다. 방법은 간단합니다. 커넥터 갤러리로 이동하여 Search Console을 선택한 다음 연결하려는 속성을 찾으면 됩니다.
데이터 스튜디오 고객센터에서 커넥터 관련 가이드를 참고하세요.
- Search Console에서 제공하는 데이터를 개선(예: 국가를 지역으로 클러스터링)하려면 먼저 웹 인터페이스에서 또는 API를 통해 데이터를 내보내야 합니다. 그런 다음 Google Sheets 또는 BigQuery를 통해 데이터를 처리하여 데이터 스튜디오에 연결하면 됩니다.
이 게시물에서는 두 번째 옵션을 살펴봅니다. 거쳐야 할 단계와 맞춤설정할 부분이 더 많기 때문입니다. 크게 다음 3가지 단계를 진행해야 합니다.
- Search Console 데이터를 내보냅니다.
- 내보낸 데이터에 자체 데이터를 추가합니다.
- 데이터를 데이터 스튜디오로 가져옵니다.
Search Console 데이터 내보내기
데이터를 내보내려면 Search Console 실적 보고서로 이동하여 기간을 선택하고 내보내기를 클릭한 후 Google Sheets를 선택합니다. 이렇게 하면 새 스프레드시트가 만들어집니다. 이 스프레드시트를 다음 단계에서 수정하여 개선합니다. 보다 자동화된 솔루션을 위해 Search Analytics API를 사용할 수도 있지만 이 게시물에서는 다루지 않습니다.
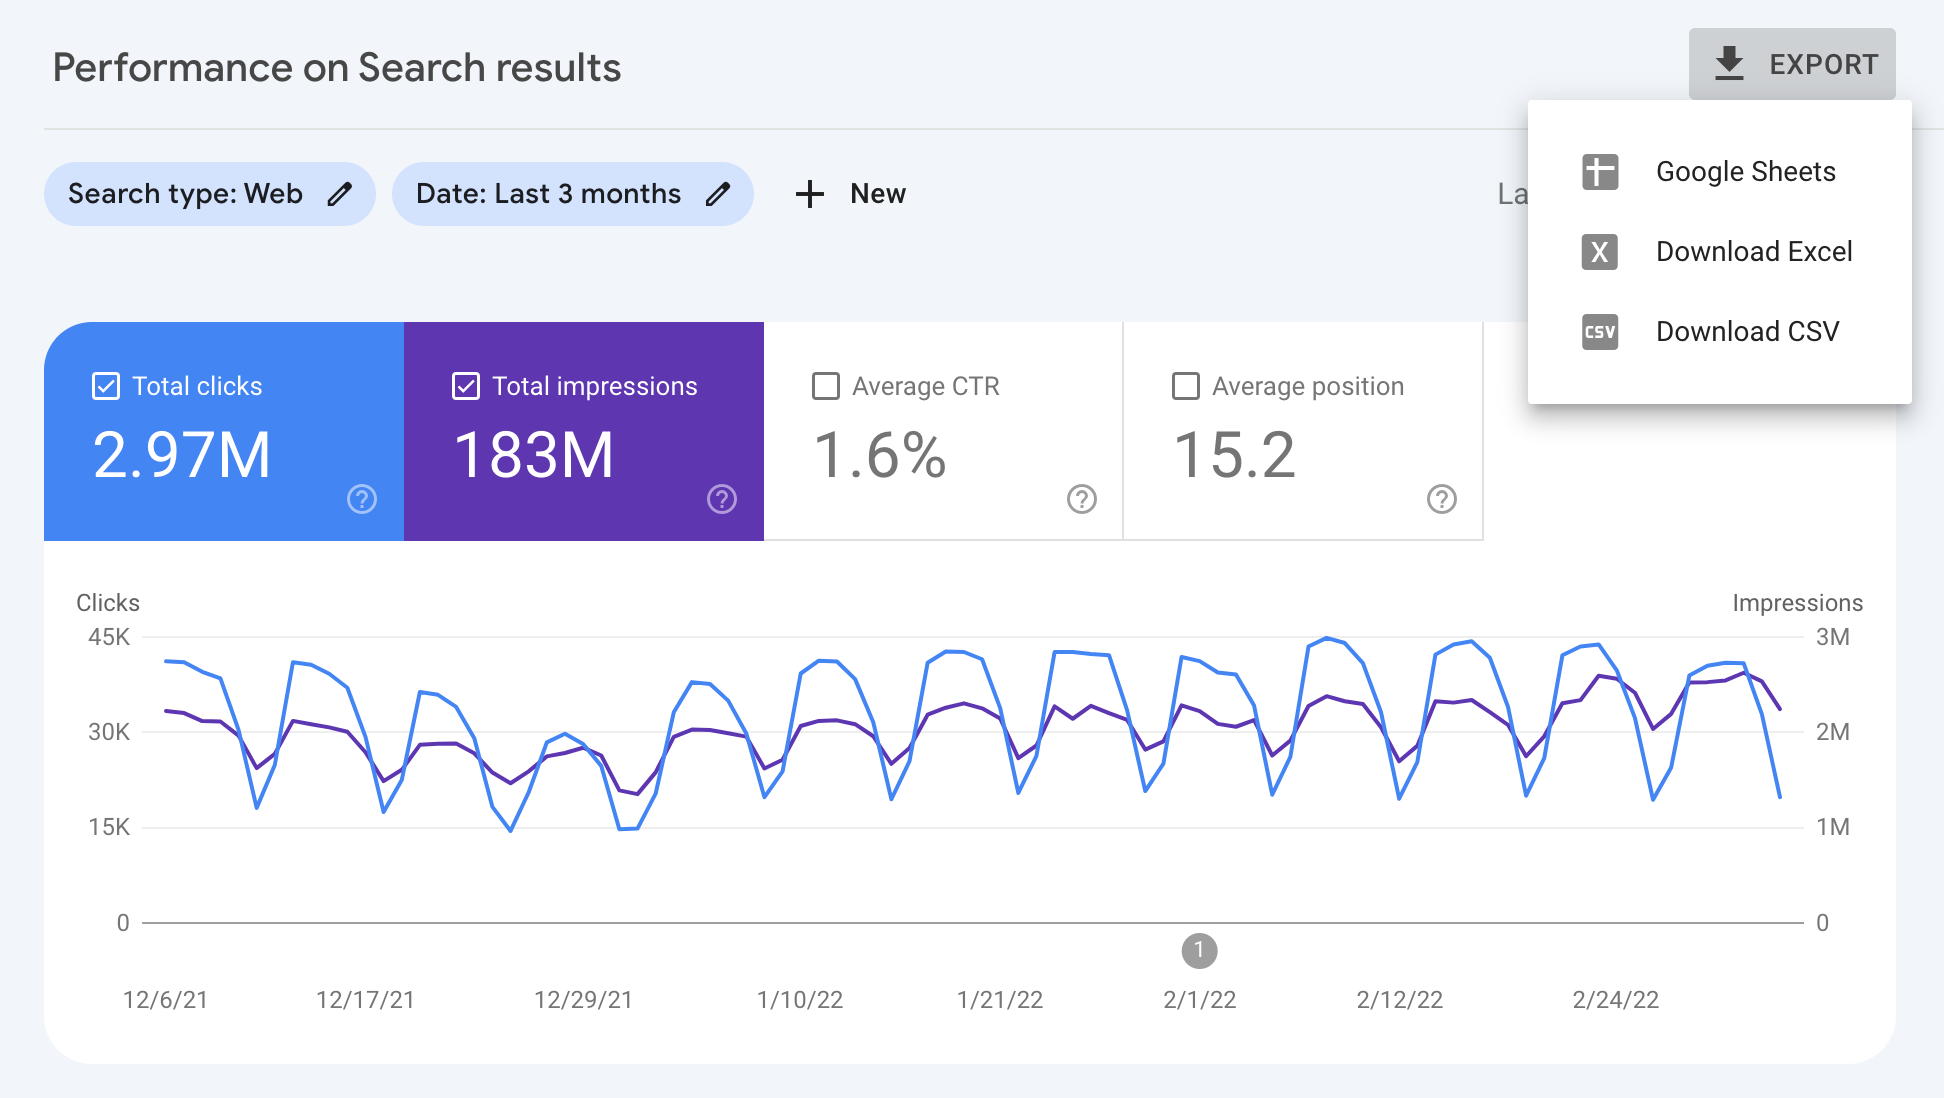
사용할 수 있는 측정기준 및 측정항목에 관한 자세한 내용은 실적 보고서 도움말 문서를 참고하세요.
Search Console 데이터 개선하기
Search Console 데이터를 개선하는 방법을 보여주기 위해 URL에서 데이터를 가져올 수 있는 Google Sheets 함수인 IMPORTDATA를 사용하겠습니다. 이 예시에서는 지역별 ISO 3166 국가 표를 가져옵니다.
Search Console에서 내보낸 데이터에 새 시트를 추가하고 첫 번째 셀에 다음 코드를 입력합니다.
=IMPORTDATA("https://gist.githubusercontent.com/richjenks/15b75f1960bc3321e295/raw/62749882ed0e9dffa3edd7a9a44a7be59df8402c/countries.md", "|")
Search Console 시트에서 지역 열을 만들고 VLOOKUP
함수를 사용하여 지역이 국가와 일치되도록 합니다.
샘플 시트는 표의 최종 결과를 보여줍니다.
삽입됨: 개선된 Search Console 국가, 지역 데이터를 보여주는 표
예시에서는 지역 데이터를 개선하지만, 동일한 절차를 사용하여 모든 유형의 정보를 추가할 수 있습니다. 가령 검색어 분류가 있다면 이를 사용하여 검색어를 카테고리로 그룹화할 수 있습니다.
데이터 스튜디오에 Google Sheets 연결하기
마지막으로 Google Sheets를 데이터 스튜디오에 연결합니다. 이를 위해 커넥터 갤러리로 이동하여 Google Sheets를 선택하고 새로 만든 스프레드시트를 찾으세요. 알맞은 시트를 선택해야 합니다.
데이터 스튜디오에 데이터가 추가되면 시각화 작업이 시작됩니다.
다음
이 시리즈의 다음 게시물인 데이터 스튜디오로 Google 검색 트래픽 등 모니터링에서는 다양한 유형의 대시보드를 알아보고 사용자가 따라 할 수 있는 단계별 예시를 소개하겠습니다.
궁금한 점이 있으면 Google 검색 센터 커뮤니티 또는 데이터 스튜디오 커뮤니티에서 문의해 주세요.
Twitter를 사용하는 경우 팔로우해 주세요. 앞으로 트위터에도 게시물을 올릴 예정이니 많은 기대 바랍니다.
게시자: 다니엘 웨이스버그(Google 검색 지원팀)
달리 명시되지 않는 한 이 페이지의 콘텐츠에는 Creative Commons Attribution 4.0 라이선스에 따라 라이선스가 부여되며, 코드 샘플에는 Apache 2.0 라이선스에 따라 라이선스가 부여됩니다. 자세한 내용은 Google Developers 사이트 정책을 참조하세요. 자바는 Oracle 및/또는 Oracle 계열사의 등록 상표입니다.
[null,null,[],[[["\u003cp\u003eThis post explains how to export, enhance, and visualize Search Console data using Google Data Studio for better website performance analysis.\u003c/p\u003e\n"],["\u003cp\u003eYou can directly connect Search Console to Data Studio or enhance the data by exporting it to Google Sheets for adding custom information like geographical regions.\u003c/p\u003e\n"],["\u003cp\u003eThis post focuses on enhancing Search Console data in Google Sheets by adding geographical regions using IMPORTDATA and VLOOKUP functions and then connecting it to Data Studio.\u003c/p\u003e\n"],["\u003cp\u003eFuture posts will cover creating data visualizations in Data Studio for monitoring and analyzing your website's search traffic data.\u003c/p\u003e\n"],["\u003cp\u003eEngage with the Google Search Central or Data Studio communities for questions and follow Google Search Central on Twitter for future updates.\u003c/p\u003e\n"]]],["This guide details how to enhance and visualize Google Search Console data in Google Data Studio. It outlines two methods for importing data: directly via the Data Studio connector or by first exporting and manipulating the data. The preferred method involves exporting Search Console data to Google Sheets, enriching it (e.g., adding geographical regions using the `IMPORTDATA` and `VLOOKUP` functions), and then connecting the enhanced spreadsheet to Data Studio for custom visualizations. The next steps include monitoring the data using Data studio.\n"],null,["# Connecting Search Console to Data Studio\n\nTuesday, March 08, 2022\n\n\n[Google Search Console](https://goo.gle/searchconsole) gives you insight into your website performance in Google Search,\nbut understanding your data can be a challenge. If you set up a custom dashboard with data visualizations that work for **you** , it might help you\nmake better decisions that are supported by data. This post is the first in a series of posts that will focus on exporting, enhancing, and visualizing\nSearch Console data using [Google Data Studio](https://support.google.com/datastudio/answer/6283323).\n\n\nIn today's post, we'll discuss how to bring your Search Console data into Google Data Studio. We'll show an example where we download Search Console data\ninto Google Sheets, enhance the data with geographical regions, and connect the spreadsheet to Data Studio.\n\n\nIn future posts, we'll discuss how to create data visualizations to help you monitor and analyze your data.\n\nPrepare the data and connect to Data Studio\n-------------------------------------------\n\n\nIn order to import Search Console data into Data Studio, there are two roads you can take:\n\n- If you are happy to see the same data as you see in Search Console, you should use the Google Data Studio data connector. This option is straightforward: visit the [connector gallery](https://datastudio.google.com/data), choose Search Console, and find the property you'd like to connect. You can find a guide to the connector in the [Data Studio Help Center](https://support.google.com/datastudio/answer/7314895).\n- If you'd like to enhance the data provided by Search Console (for example, clustering countries into regions), you should first export the data from the web interface or through the API. Then, you can manipulate the data with Google Sheets or BigQuery and connect it to Data Studio.\n\n\nIn this post we'll discuss the second option, since it requires more steps and offers more customization opportunities. There are three main steps you need to take:\n\n1. Export Search Console data.\n2. Add your own data on top of it.\n3. Import it into Data Studio.\n\n### Export Search Console data\n\n\nIn order to export your data, visit the Search Console [Performance report](https://search.google.com/search-console/performance/search-analytics),\nchoose a date range, click **Export** , and choose Google Sheets. This will create a new spreadsheet, which we'll enhance in the next step. You can also use\nthe [Search Analytics API](/webmaster-tools/v1/searchanalytics/query) for a more automated solution, but that's\nout of scope for this post.\n\n\nYou can read more about the dimensions and metrics that will be available to you in the [Performance\nreport help documentation](https://support.google.com/webmasters/answer/7576553#dimensions).\n\n### Enhance Search Console data\n\n\nTo show how to enhance your Search Console data, we'll use a neat Google Sheets function, [IMPORTDATA](https://support.google.com/docs/answer/3093335),\nwhich can import data from a URL. In our example, we're importing the\n[ISO 3166 countries by region](https://gist.githubusercontent.com/richjenks/15b75f1960bc3321e295/raw/62749882ed0e9dffa3edd7a9a44a7be59df8402c/countries.md) table.\n\n\nAdd a new sheet to the data you exported from Search Console and enter the following code to the first cell: \n\n```text\n=IMPORTDATA(\"https://gist.githubusercontent.com/richjenks/15b75f1960bc3321e295/raw/62749882ed0e9dffa3edd7a9a44a7be59df8402c/countries.md\", \"|\")\n```\n\n\nIn the Search Console sheet, create a column for **Region** and use the [VLOOKUP](https://support.google.com/docs/answer/3093318)\nfunction to match the regions to the countries.\n\n\nHere is a [sample sheet](https://docs.google.com/spreadsheets/d/1WoyovWWCLq9uaYfnsICL4uMQMApaoNhjMf8U4nl0ZHQ/) showing how the final table would look.\n\n\n*Embedded: Table showing Search Console data enhanced with country regions*\n\n\nEven though we're using an example to enhance the geographical data, you can use the same process to add any type of information. For example, if you have a query classification,\nyou could use that to group queries into categories.\n\n### Connect Google Sheets to Data Studio\n\n\nFinally, connect your Google Sheets to Data Studio. To do this, visit the [connector gallery](https://datastudio.google.com/data),\nchoose Google Sheets, and find your newly created spreadsheet; but make sure to choose the right sheet.\n\n\nOnce the data is in Data Studio, the visualization work begins...\n\nNext\n----\n\n\nIn the next post in this series, [Monitoring Search traffic (and more!) with Data Studio](/search/blog/2022/03/monitoring-dashboard), we'll discuss different types of dashboards and provide step-by-step examples for you to follow along.\n\n\nAs always, let us know if you have any questions through the [Google\nSearch Central Community](https://support.google.com/webmasters/threads?thread_filter=(category:search_console)) or the [Data Studio Community](https://support.google.com/datastudio/threads?thread_filter=(category:connect_to_data)).\nAlso, if you're on Twitter, make sure to [follow us](https://twitter.com/googlesearchc); we'll announce future posts over there - *stay tuned!*\n\nPosted by [Daniel Waisberg](https://www.danielwaisberg.com), Search Advocate"]]